

Introduction
In this article, I will explain about the use of ng2-google-charts. I will explain how to implement ng2 google charts in our project. And also, I will discuss some fundamentals of ng2 google charts.
Prerequisites
- Angular 12
- HTML/Bootstrap
For this article, I have created an Angular project using Angular 12. For creating an Angular project, we need to follow the following steps
Create Project
I have created a project using the following command in the Command Prompt.
ng new ng2chartexampleOpen a project in Visual Studio Code using the following commands.
cd ng2chartexample
code .
Installation
The next step is to install the ng2 google charts-related dependencies using the following commands.
npm i ng2-google-chartsImporting
The next step is to import the Ng2GoogleChartsModule in your app.module.ts. This will allow you to use all of the features provided by this Ng2 Google Charts Library.
import { NgModule } from '@angular/core';
import { BrowserModule } from '@angular/platform-browser';
import { Ng2GoogleChartsModule } from 'ng2-google-charts';

import { AppRoutingModule } from './app-routing.module';
import { AppComponent } from './app.component';

@NgModule({
  declarations: [
    AppComponent
  ],
  imports: [
    BrowserModule,
    AppRoutingModule,
    Ng2GoogleChartsModule
  ],
  providers: [],
  bootstrap: [AppComponent]
})
export class AppModule { }
How to use ng2 google chart functionality
We need to add below line in HTML page to use Ng2 Google Charts.
<google-chart></google-chart>Org-Chart
component.ts
import { Component } from '@angular/core';
import {
  GoogleChartInterface
} from 'ng2-google-charts';

@Component({
  selector: 'app-root',
  templateUrl: './app.component.html',
  styleUrls: ['./app.component.css']
})
export class AppComponent {
  name = 'Angular';

  public orgChart: GoogleChartInterface = {
    chartType: 'OrgChart',
    dataTable: [
      ['Name',   'Manager', 'Tooltip'],
      [{v: 'Gajendra', f: 'Gajendra<div style="color:red; font-style:italic">Manager</div>'}, '', 'The President'],
      [{v: 'Rohit', f: 'Rohit<div style="color:red; font-style:italic">Team Lead</div>'}, 'Gajendra', 'VP'],
      [{v:'Suchit', f: 'Suchit<div style="color:red; font-style:italic">Sr. Engineer</div>'}, 'Rohit', 'SE'],
      [{v:'Ajay', f: 'Suchit<div style="color:red; font-style:italic">Sr. Engineer</div>'}, 'Rohit', 'SE'],
      [{v:'Ishan', f: 'Ishan<div style="color:red; font-style:italic">Engineer</div>'}, 'Ajay', 'JE']
    ],
    options: {
      allowHtml: true,
      allowCollapse: true
    }
  };

}
component.html
<google-chart [data]="orgChart"></google-chart>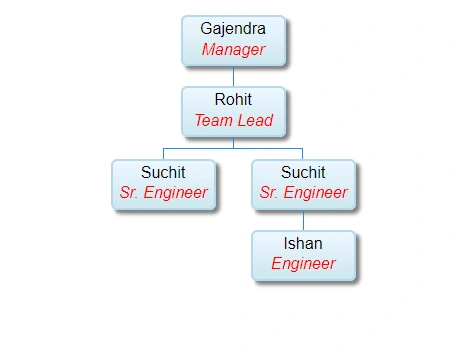
Pie-Chart
component.ts
import { Component } from '@angular/core';
import {
  GoogleChartInterface, GoogleChartType
} from 'ng2-google-charts';

@Component({
  selector: 'app-root',
  templateUrl: './app.component.html',
  styleUrls: ['./app.component.css']
})
export class AppComponent {
  name = 'Angular';

  public pieChart: GoogleChartInterface = {
    chartType: GoogleChartType.PieChart,
    dataTable: [
      ['Task', 'Hours per Day'],
      ['Work',     6],
      ['Lunch',      1],
      ['Stand-Up',  1],
      ['Shore-end', 1],
      ['Fun',    1]
    ],
    options: {
      allowHtml: true,
      allowCollapse: true
    }
  };

}
component.html
<google-chart [data]="pieChart"></google-chart>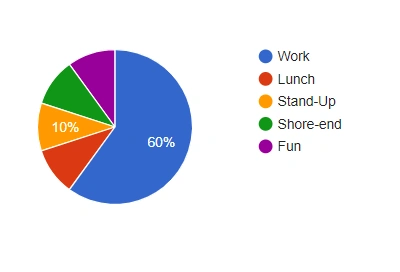
Line-Chart
component.ts
import { Component } from '@angular/core';
import {
  GoogleChartInterface, GoogleChartType
} from 'ng2-google-charts';

@Component({
  selector: 'app-root',
  templateUrl: './app.component.html',
  styleUrls: ['./app.component.css']
})
export class AppComponent {
  name = 'Angular';

  public lineChart: GoogleChartInterface = {
    chartType: GoogleChartType.LineChart,
    dataTable: [
      ['Task', 'Hours per Day'],
      ['Work',     6],
      ['Lunch',      1],
      ['Stand-Up',  1],
      ['Shore-end', 1],
      ['Fun',    1]
    ],
    options: {
      allowHtml: true,
      allowCollapse: true
    }
  };

}
component.html
<google-chart [data]="lineChart"></google-chart>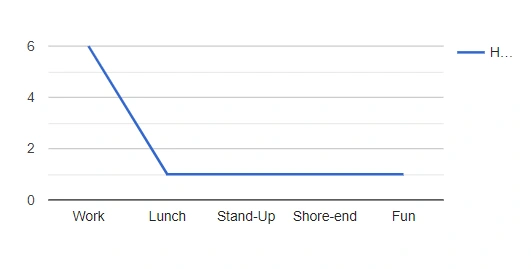
Column-Chart
component.ts
import { Component } from '@angular/core';
import {
  GoogleChartInterface, GoogleChartType
} from 'ng2-google-charts';

@Component({
  selector: 'app-root',
  templateUrl: './app.component.html',
  styleUrls: ['./app.component.css']
})
export class AppComponent {
  name = 'Angular';

  public columnChart: GoogleChartInterface = {
    chartType: GoogleChartType.ColumnChart,
    dataTable: [
      ['Task', 'Hours per Day'],
      ['Work',     6],
      ['Lunch',      1],
      ['Stand-Up',  1],
      ['Shore-end', 1],
      ['Fun',    1]
    ],
    options: {
      allowHtml: true,
      allowCollapse: true
    }
  };

}
component.html
<google-chart [data]="columnChart"></google-chart>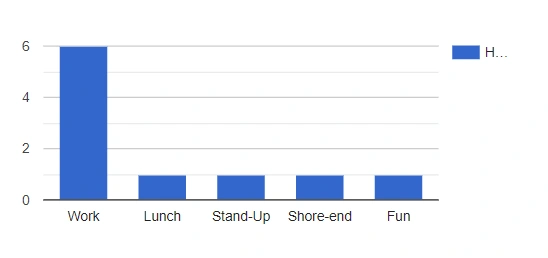
Column-Chart
component.ts
import { Component } from '@angular/core';
import {
  GoogleChartInterface, GoogleChartType
} from 'ng2-google-charts';

@Component({
  selector: 'app-root',
  templateUrl: './app.component.html',
  styleUrls: ['./app.component.css']
})
export class AppComponent {
  name = 'Angular';

  public areaChart: GoogleChartInterface = {
    chartType: GoogleChartType.AreaChart,
    dataTable: [
      ['Task', 'Hours per Day'],
      ['Work',     6],
      ['Lunch',      1],
      ['Stand-Up',  1],
      ['Shore-end', 1],
      ['Fun',    1]
    ],
    options: {
      allowHtml: true,
      allowCollapse: true
    }
  };

}
component.html
<google-chart [data]="areaChart"></google-chart>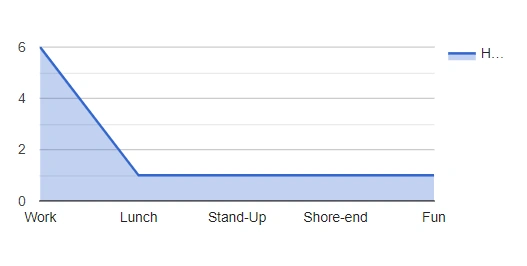
Summary
In this article, I have discussed various features of Ng2 Google Chart with example in Angular.
Sarathlal SaseendranPosted Apr 5, 2022, 3:52 PM
Interesting one. Have you tried click events with google charts?