

Introduction
This article introduces use of the Google Charts API with a database in ASP.NET. Google has a jQuery API for chart and graph visuals. I have explored a little more and used them with a SQL Server database data and simply plunged chart data with jQuery into an aspx page and it works.
At the following URL you will find technical documentation of the Google Charts API:
https://google-developers.appspot.com/chart/
1. Combo charts
The final result will be as shown below.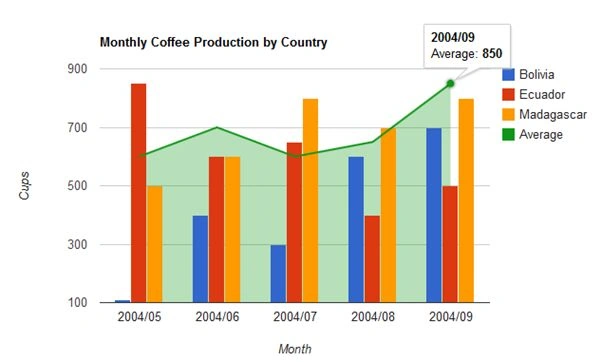
Step 1
Prepare the data in the SQL Server database as in the following: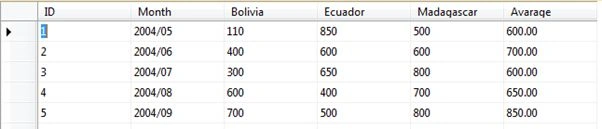
Step 2
The following is the Stored Procedure to fetch data required for the chart:
- CREATE PROCEDURE dbo.GetData
- AS
- BEGIN
- SELECT *
- FROM tbl_data
- END
Step 3
The following is the .aspx Page Script:
- <%@ Page Language="C#" AutoEventWireup="true" CodeFile="Default.aspx.cs" Inherits="_Default" %>
- <!DOCTYPE html PUBLIC "-//W3C//DTD XHTML 1.0 Transitional//EN" "http://www.w3.org/TR/xhtml1/DTD/xhtml1-transitional.dtd">
- <html xmlns="http://www.w3.org/1999/xhtml">
- <head runat="server">
- <title>Charts Example</title>
- </head>
- <body>
- <form id="form1" runat="server">
- <div>
- <script type="text/javascript" src="https://www.google.com/jsapi"></script>
- <asp:GridView ID="gvData" runat="server">
- </asp:GridView>
- <br />
- <br />
- <asp:Literal ID="ltScripts" runat="server"></asp:Literal>
- <div id="chart_div" style="width: 660px; height: 400px;">
- </div>
- </div>
- </form>
- </body>
- </html>
Step 4
The following is the ..aspx Page code behind:
- #region " [ Using ] "
- using System;
- using System.Web.UI;
- using System.Data.SqlClient;
- using System.Data;
- using System.Configuration;
- using System.Text;
- #endregion
- public partial class _Default : System.Web.UI.Page
- {
- protected void Page_Load(object sender, EventArgs e)
- {
- if (!Page.IsPostBack)
- {
- // Bind Gridview
- BindGvData();
- // Bind Charts
- BindChart();
- }
- }
- private void BindGvData()
- {
- gvData.DataSource = GetChartData();
- gvData.DataBind();
- }
- private void BindChart()
- {
- DataTable dsChartData = new DataTable();
- StringBuilder strScript = new StringBuilder();
- try
- {
- dsChartData = GetChartData();
- strScript.Append(@"<script type='text/javascript'>
- google.load('visualization', '1', {packages: ['corechart']});</script>
- <script type='text/javascript'>
- function drawVisualization() {
- var data = google.visualization.arrayToDataTable([
- ['Month', 'Bolivia', 'Ecuador', 'Madagascar', 'Average'],");
- foreach (DataRow row in dsChartData.Rows)
- {
- strScript.Append("['" + row["Month"] + "'," + row["Bolivia"] + "," +
- row["Ecuador"] + "," + row["Madagascar"] + "," + row["Avarage"] + "],");
- }
- strScript.Remove(strScript.Length - 1, 1);
- strScript.Append("]);");
- strScript.Append("var options = { title : 'Monthly Coffee Production by Country', vAxis: {title: 'Cups'}, hAxis: {title: 'Month'}, seriesType: 'bars', series: {3: {type: 'area'}} };");
- strScript.Append(" var chart = new google.visualization.ComboChart(document.getElementById('chart_div')); chart.draw(data, options); } google.setOnLoadCallback(drawVisualization);");
- strScript.Append(" </script>");
- ltScripts.Text = strScript.ToString();
- }
- catch
- {
- }
- finally
- {
- dsChartData.Dispose();
- strScript.Clear();
- }
- }
- /// <summary>
- /// fetch data from mdf file saved in app_data
- /// </summary>
- /// <returns>DataTable</returns>
- private DataTable GetChartData()
- {
- DataSet dsData = new DataSet();
- try
- {
- SqlConnection sqlCon = new SqlConnection(ConfigurationManager.ConnectionStrings["connectionString"].ConnectionString);
- SqlDataAdapter sqlCmd = new SqlDataAdapter("GetData", sqlCon);
- sqlCmd.SelectCommand.CommandType = CommandType.StoredProcedure;
- sqlCon.Open();
- sqlCmd.Fill(dsData);
- sqlCon.Close();
- }
- catch
- {
- throw;
- }
- return dsData.Tables[0];
- }
- }
Step 5
The following is the .Web.config file:
- <?xml version="1.0"?>
- <configuration>
- <system.web>
- <compilation debug="true" targetFramework="4.0"/>
- </system.web>
- <connectionStrings>
- <add name="connectionString" connectionString="Data Source=.\SQLEXPRESS;AttachDbFilename=|DataDirectory|\Database.mdf;Integrated Security=True;User Instance=True" providerName="System.Data.SqlClient"/>
- </connectionStrings>
- </configuration>
Step 6
Run it.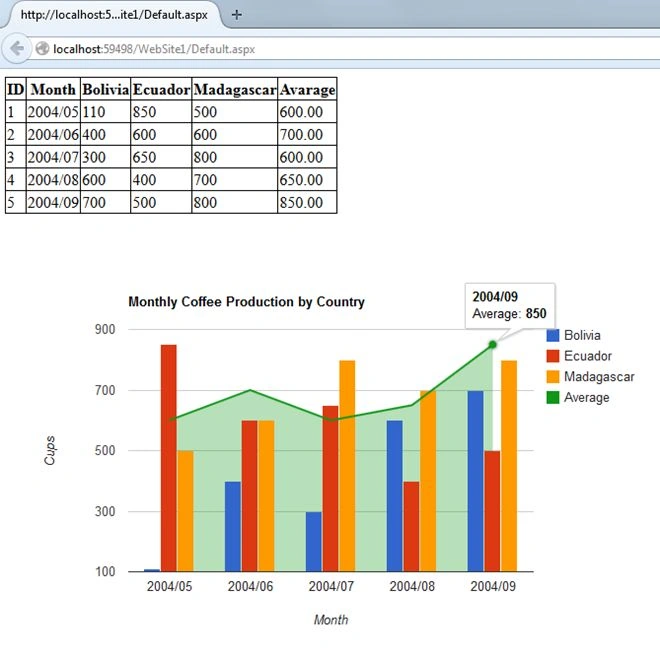
2. Pie Chart
The final result will be as shown below.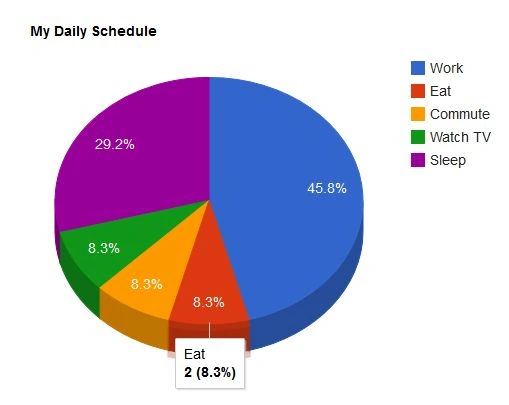
Step 1
Prepare the data as in the following: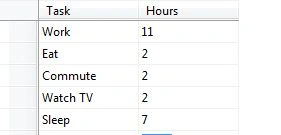
Step 2
Prepare the Stored Procedure as in the following:
- CREATE PROCEDURE GetPieChartData
- AS
- begin
- SELECT *
- FROM tbl_Data2
- end
Step 3
The following is the .aspx script:
- <%@ Page Language="C#" AutoEventWireup="true" CodeFile="frmPieChart.aspx.cs" Inherits="frmPieChart" %>
- <!DOCTYPE html PUBLIC "-//W3C//DTD XHTML 1.0 Transitional//EN" "http://www.w3.org/TR/xhtml1/DTD/xhtml1-transitional.dtd">
- <html xmlns="http://www.w3.org/1999/xhtml">
- <head runat="server">
- <title></title>
- </head>
- <body>
- <form id="form1" runat="server">
- <div>
- <script type="text/javascript" src="https://www.google.com/jsapi"></script>
- <asp:GridView ID="gvData" runat="server">
- </asp:GridView>
- <br />
- <br />
- <asp:Literal ID="ltScripts" runat="server"></asp:Literal>
- <div id="piechart_3d" style="width: 900px; height: 500px;">
- </div>
- </div>
- </form>
- </body>
- </html>
Step 4
The following is the .aspx code behind:
- #region " [ Using ] "
- using System;
- using System.Web.UI;
- using System.Data.SqlClient;
- using System.Data;
- using System.Configuration;
- using System.Text;
- #endregion
- public partial class frmPieChart : System.Web.UI.Page
- {
- protected void Page_Load(object sender, EventArgs e)
- {
- if (!Page.IsPostBack)
- {
- // Bind Gridview
- BindGvData();
- // Bind Charts
- BindChart();
- }
- }
- private void BindGvData()
- {
- gvData.DataSource = GetChartData();
- gvData.DataBind();
- }
- private void BindChart()
- {
- DataTable dsChartData = new DataTable();
- StringBuilder strScript = new StringBuilder();
- try
- {
- dsChartData = GetChartData();
- strScript.Append(@"<script type='text/javascript'>
- google.load('visualization', '1', {packages: ['corechart']}); </script>
- <script type='text/javascript'>
- function drawChart() {
- var data = google.visualization.arrayToDataTable([
- ['Task', 'Hours of Day'],");
- foreach (DataRow row in dsChartData.Rows)
- {
- strScript.Append("['" + row["Task"] + "'," + row["Hours"] + "],");
- }
- strScript.Remove(strScript.Length - 1, 1);
- strScript.Append("]);");
- strScript.Append(@" var options = {
- title: 'My Daily Schedule',
- is3D: true,
- }; ");
- strScript.Append(@"var chart = new google.visualization.PieChart(document.getElementById('piechart_3d'));
- chart.draw(data, options);
- }
- google.setOnLoadCallback(drawChart);
- ");
- strScript.Append(" </script>");
- ltScripts.Text = strScript.ToString();
- }
- catch
- {
- }
- finally
- {
- dsChartData.Dispose();
- strScript.Clear();
- }
- }
- /// <summary>
- /// fetch data from mdf file saved in app_data
- /// </summary>
- /// <returns>DataTable</returns>
- private DataTable GetChartData()
- {
- DataSet dsData = new DataSet();
- try
- {
- SqlConnection sqlCon = new SqlConnection(ConfigurationManager.ConnectionStrings["connectionString"].ConnectionString);
- SqlDataAdapter sqlCmd = new SqlDataAdapter("GetPieChartData", sqlCon);
- sqlCmd.SelectCommand.CommandType = CommandType.StoredProcedure;
- sqlCon.Open();
- sqlCmd.Fill(dsData);
- sqlCon.Close();
- }
- catch
- {
- throw;
- }
- return dsData.Tables[0];
- }
- }
Step 5
Run it.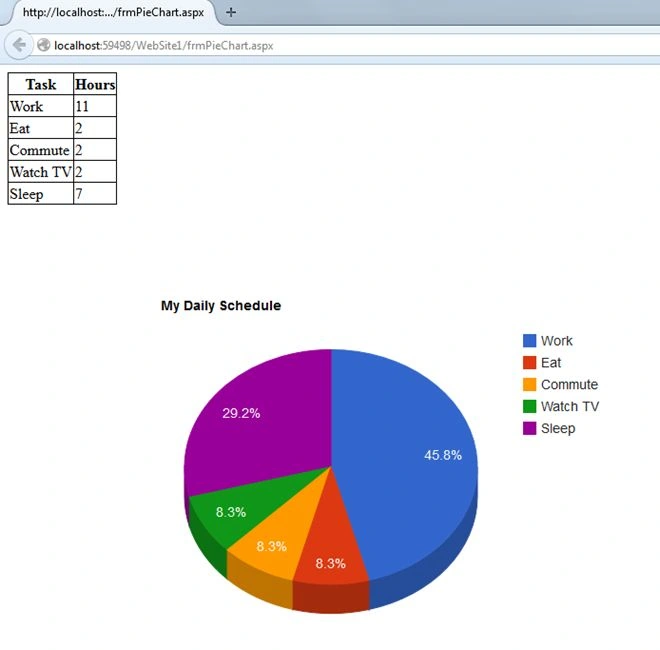
Vijay GuptaPosted Jan 1, 2018, 11:04 AM
In this plz show the coding of pichart
Vijay GuptaPosted Jan 1, 2018, 10:41 AM
Throw; in this line error is coming how can solve
hurk peterPosted Aug 31, 2017, 12:24 AM
Dude this does not work !! J I did anyway by following your example and s? Shit
hurk peterPosted Aug 26, 2017, 4:38 AM
Cara isso n?o funciona!! j? fiz de todo jeito seguindo seu exemplo e s? da merda
prawit janePosted May 23, 2015, 5:43 PM
help problem With Entity Thanks ^^
prawit janePosted May 23, 2015, 3:40 PM
good job
Andrew HensonPosted May 4, 2015, 5:05 AM
Thanks for the solution
Sravan KumarPosted Feb 20, 2015, 1:05 AM
thank u, very helpful
Roger MadhuPosted Nov 25, 2014, 12:06 AM
Great Article. Thank you.
Anupam SinghPosted Jul 17, 2014, 3:24 AM
Very useful. thanx for sharing..
Amruta BPosted Jul 14, 2014, 6:32 AM
helpful article
Saineshwar BageriPosted Jul 14, 2014, 12:21 AM
Nice article
Khan Abrar AhmedPosted Jul 13, 2014, 1:53 AM
Nice Artical