Loading
Topic
alerting
7 posts about alerting by 7 contributors.
Know alerting? Share what you know with developers who are learning it.
+ Follow alertingBe the first to follow this
- Articles
- 7
- Contributors
- 7
Articles about alerting
- Article · DevOps
What Is Grafana and How to Implement It Effectively
Learn Grafana for DevOps monitoring! Visualize metrics, logs, and traces from Prometheus, Elasticsearch, and more. Set alerts and improve system reliability.
- Article · Salesforce
Designing On-Call and Incident Response for Salesforce Integrations
Learn to design effective on-call & incident response for Salesforce integrations. Minimize downtime, protect data, and maintain customer trust. Plan for failure!
- Article · RevealBi
Prometheus & Grafana Explained: How They're Used in Real-World Systems
Unlock real-time system insights with Prometheus and Grafana! This guide explores their features, use cases, and best practices for effective monitoring. Essential for modern observability.
- Article · Data Science
Harnessing Splunk for Intelligent Data Ingestion, Visualization, and Alerting
Unlock real-time insights with Splunk: data ingestion, visualization, and alerting for operational intelligence. Drive data-driven decisions and enhance security.
- Article · ASP.NET Core
Real-Time Cache Monitoring and Alerting with NCache in ASP.NET Core Web API
Boost ASP.NET Core Web API performance with NCache! This guide details integrating NCache for distributed caching, real-time monitoring, and proactive alerting. Learn to configure NCache, track cache health via NCache Web Manager or PowerShell, and set up notifications for critical events like node failures or high resource usage. Optimize your caching strategy and ensure a seamless user experience with enterprise-grade visibility and control. Explore programmatic event notifications and integration with Grafana/Prometheus for advanced monitoring.
- Article · Azure
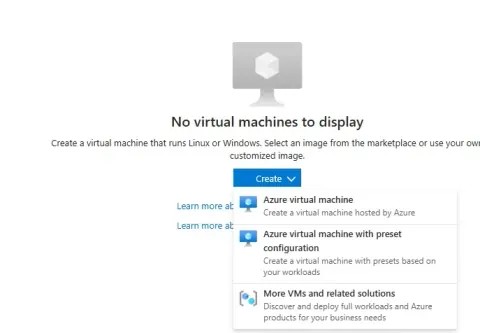
Getting started with Grafana for Ubuntu in Azure Cloud
Grafana is pivotal for visualizing and analyzing data, ideal for monitoring system performance. Installing Grafana via Azure, utilizing a virtual machine. It covers key steps like SSH key setup, connecting via Putty, and installing Grafana on Ubuntu, ensuring proper firewall configuration for access on port 3000.
- Article · .NET Core
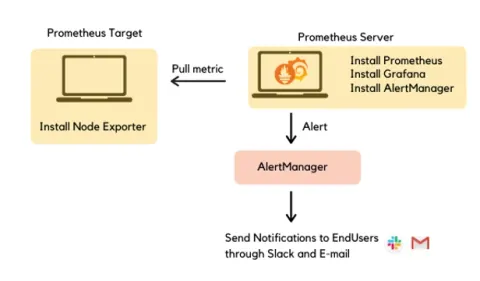
Alerting In Prometheus With AlertManager
In this article, you will learn about Alerting in Prometheus with AlertManager.