3 posts about Apexcharts by 2 contributors.
Know Apexcharts? Share what you know with developers who are learning it.
In this snippet, we are working on visualizing vehicle category counts (B and C) using a donut chart powered by ApexCharts.
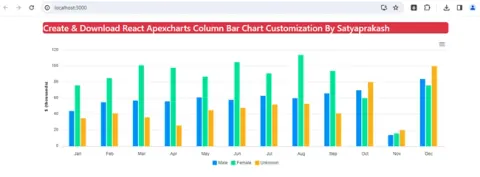
In this tutorial, we will learn how to create a vertical column bar chart component in the React JS functional component. Creating a Column Bar Chart component in React using Apexcharts and Bootstrap. Configure data and options for visualization.

Create an Area chart component in a React.js functional component using Apexcharts and Bootstrap libraries. Explore Apexcharts' features, step-by-step implementation, and visualization of data.
DevSocialUpcoming · 3rd editionAI Agents ConferenceNov 23–27, 2026Live onlineMembers only16days leftRegisterPublish an article in this category and earn +1,000 SHARP when it is approved.
Write an article