Loading
Topic
Bubble Chart
5 posts about Bubble Chart by 5 contributors.
Know Bubble Chart? Share what you know with developers who are learning it.
+ Follow Bubble ChartBe the first to follow this
- Articles
- 5
- Contributors
- 5
Everything about Bubble Chart
- Article · AJAX
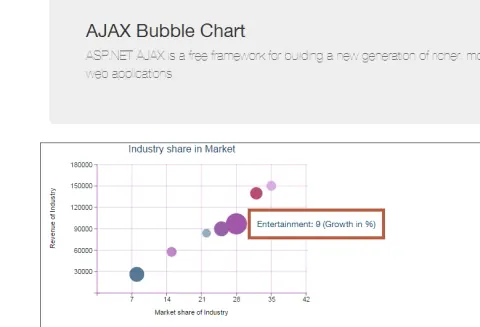
AJAX Control Toolkit Tutorial: Bubble Chart - Part 11
In this article, we will discover how to leverage the power of the AJAX Control Toolkit with our comprehensive tutorial series. In this eleventh installment, delve into the intricacies of creating Bubble Charts, a dynamic data visualization tool.
- Article · C#
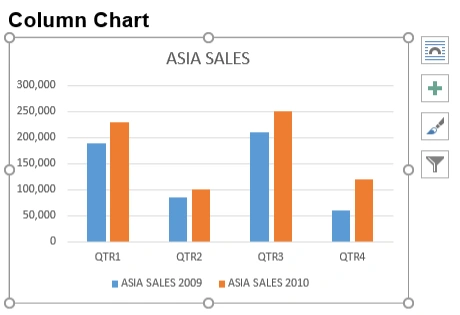
Create Various Types of Charts in Word Documents in C# and VB.NET
By creating charts in your Word document, you can enhance the impact of your content and make it more engaging and informative for your readers. In this article, we will explore how to create Column Chart, Line Chart, Pie Chart, Bar Chart, Scatter Chart, Bubble Chart, 3D Surface Chart in a Word document using C# and VB.NET.
- Article · ASP.NET Core
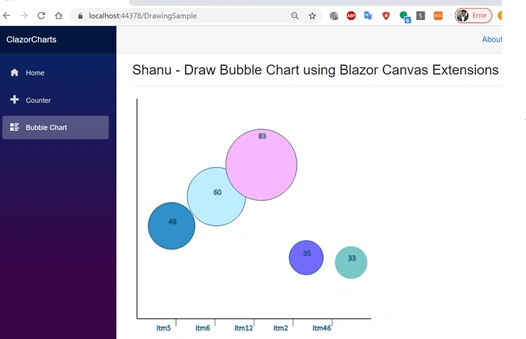
Draw Dynamic ASP.NET Core Blazor Bubble Chart Using Canvas Extensions
In this article we will see in detail on how to draw our own bar chart for ASP.NET Core Blazor Web Application using HTML5 Canvas Blazor Extensions.
- Article · ASP.NET
Bubble Type Chart in ASP.Net
In this article we will learn about the Bubble Type Chart of ASP.Net.