Loading
Topic
Chart Type
5 posts about Chart Type by 2 contributors.
Know Chart Type? Share what you know with developers who are learning it.
+ Follow Chart TypeBe the first to follow this
- Articles
- 5
- Contributors
- 2
Everything about Chart Type
- Article · Power BI
How To Create A Sparklines In Power BI Tables And Matrix Visual?
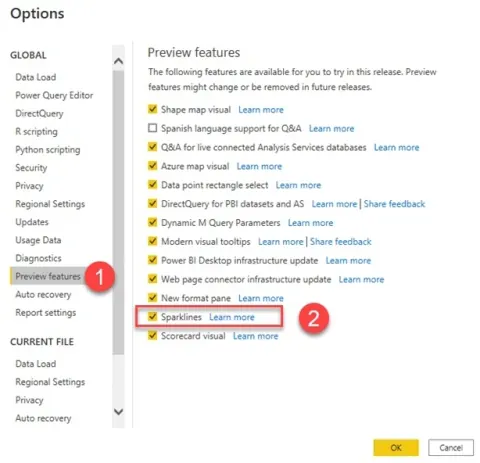
This article explores the new "Sparklines" feature in Power BI as of December 2021, which allows users to visualize trends within table and matrix visuals. Sparklines provide a compact way to compare data trends, such as sales and profit.
- Article · ASP.NET
ThreeLineBreak Chart Type In ASP.Net
In this article, we will learn about the ThreeLineBreak chart type of ASP.Net.
- Article · ASP.NET
RangeBar Chart Type in ASP.Net
In this article, we will learn about the RangeBar Chart Type of ASP.Net.
- Article · ASP.NET
BoxPlot Chart Type in ASP.Net
In this article, we will learn about the BoxPlot Chart Type of ASP.Net.