Loading
Topic
Chrome DevTools
9 posts about Chrome DevTools by 5 contributors.
Know Chrome DevTools? Share what you know with developers who are learning it.
+ Follow Chrome DevToolsBe the first to follow this
- Articles
- 9
- Contributors
- 5
Articles about Chrome DevTools
- Article · JavaScript
Core Web Vitals INP: How to Find What Makes a Website Slow to Respond
Learn how Interaction to Next Paint (INP) measures web responsiveness, how to diagnose slow interactions in Chrome DevTools, and how to reduce JavaScript and rendering delays.
- Article · Node.js
How to Find a Memory Leak in Node.js Using Heap Snapshots
Learn how to diagnose Node.js memory leaks by monitoring memory usage, capturing V8 heap snapshots, comparing retained objects, and tracing references with Chrome DevTools.
- Article · Node.js
How to Find a Memory Leak in Node.js Using Heap Snapshots
Learn how to detect Node.js memory leaks by monitoring memory usage, capturing V8 heap snapshots, and comparing retained objects to find lingering references.
- Article · Node.js
How to Find Node.js Memory Leaks with Heap Snapshots
Learn how to track Node.js memory growth, capture and compare V8 heap snapshots, and trace retained objects with Chrome DevTools.
- Article · Cyber Security
Chrome Connection Allowlists Give Web Apps More Control Over Network Access
Learn how Chrome Connection Allowlists use the Connection-Allowlist HTTP header to restrict network destinations and strengthen web application security.
- Article · JavaScript
How to Fix Memory Leaks in JavaScript Applications
Fix JavaScript memory leaks! Learn to identify and prevent performance degradation, crashes, and high RAM usage with practical solutions and best practices.
- Article · JavaScript
How to Debug Memory Leaks in Modern JavaScript Applications?
Master JavaScript memory leak debugging! Learn to identify & fix issues with Chrome DevTools, detached DOM elements, & event listeners. Keep apps fast & stable.
- Article · SharePoint
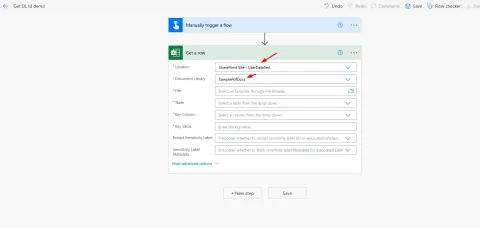
How to find SharePoint Document Library ID using Power Automate and Chrome DevTools
Discover two simple methods to find your SharePoint Document Library ID without Graph Explorer! Use Power Automate tricks or Chrome DevTools Network tab for quick retrieval.
- Article · Careers and Jobs
Top Tools for Debugging and Profiling Web Applications
A detailed guide to top tools and techniques for debugging and profiling web applications, with a focus on Angular. Covers Chrome DevTools, Augury, NgRx DevTools, memory profiling, and performance optimization strategies. Helps senior developers maintain high-quality, scalable, and performant applications in production.