Loading
Topic
Comparative
1 post about Comparative by 1 contributor.
Know Comparative? Share what you know with developers who are learning it.
+ Follow ComparativeBe the first to follow this
- Articles
- 1
- Contributors
- 1
Articles about Comparative
- Article · Python
Comparative Analysis of Monthly Sales
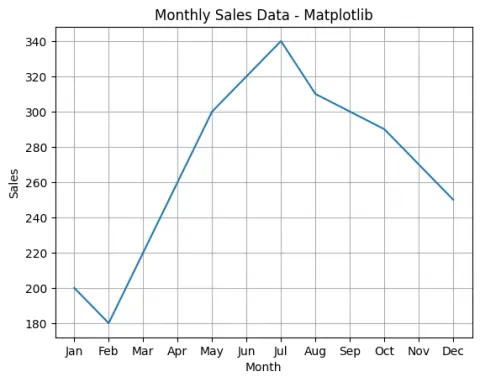
We will explore how to create line charts using three popular Python libraries: Matplotlib, Seaborn, and Plotly. By visualizing the same set of sample sales data across different months, we'll see how each library brings its unique style and features to the table.