Loading
Topic
D3JS
6 posts about D3JS by 3 contributors.
Know D3JS? Share what you know with developers who are learning it.
+ Follow D3JSBe the first to follow this
- Articles
- 6
- Contributors
- 3
Everything about D3JS
- Article · JavaScript
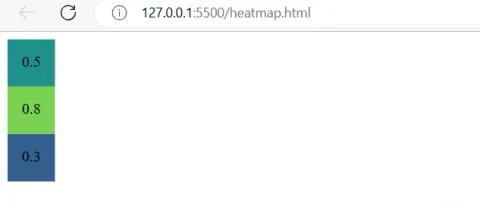
Drawing a Heatmap Using D3.js
Heatmaps are powerful visual representations that can help us analyze and understand patterns in data. They provide a graphical representation of data where the values are represented by colors. In this article, we will explore how to create a heatmap using D3.js, a popular JavaScript library for data visualization.
- Article · HTML 5
Designing Responsive Charts Using D3JS
This article demonstrates how to make your charts more user-friendly and interactive using D3.JS. Learn to enhance your charts with responsiveness, zoom, and scroll effects. The guide includes code snippets for HTML, JavaScript, and CSS, along with a demo to showcase these features in action.
- Article · JavaScript
Scatter Plot Using D3JS
Learn to visualize data with ease using D3JS in this guide. Explore how to use JSON data to create dynamic charts like scatter plots through simple HTML, CSS, and JavaScript snippets. The article covers a demo with detailed code and output examples to get you started on effective data visualization.
- Article · JavaScript
Creating Bar Chart From D3JS Using JSON Data
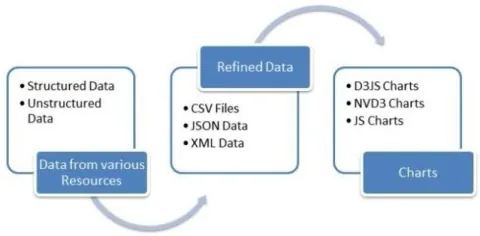
This article explores using JSON data with D3JS for creating various charts to meet application needs. It covers an overview of D3JS, common problems in data visualization, and provides practical solutions with code snippets in HTML, JavaScript, and CSS.
- Article · Angular
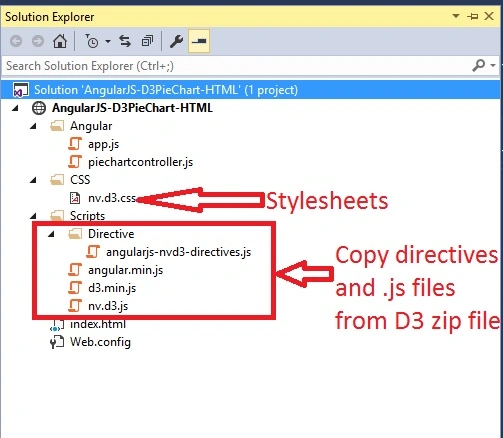
How to make Pie Chart using D3 with AngularJS
In this article we will learn how we can make Pie Chart using D3 Js with AngularJS.