Loading
Topic
Donut Chart
2 posts about Donut Chart by 2 contributors.
Know Donut Chart? Share what you know with developers who are learning it.
+ Follow Donut ChartBe the first to follow this
- Articles
- 2
- Contributors
- 2
Everything about Donut Chart
- Article · SharePoint
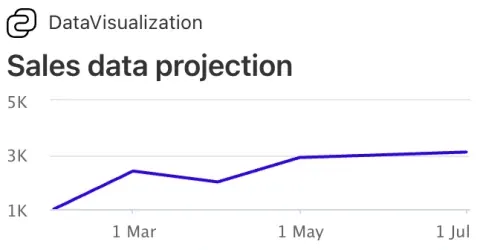
Create a Data Visualization Adaptive Card Extension
Creating a Data Visualization Adaptive Card Extension (ACE) for SharePoint Online using the SharePoint Framework (SPFx) involves building a custom ACE component to display visual data in the form of charts or other visual elements.
- Article · Power BI
Getting Started With Donut Chart Report
This article is all about getting started with Donut Chart Report and how to make Donut Chart Report.