Loading
Topic
.NET profiling
4 posts about .NET profiling by 4 contributors.
Know .NET profiling? Share what you know with developers who are learning it.
+ Follow .NET profilingBe the first to follow this
- Articles
- 4
- Contributors
- 4
Everything about .NET profiling
- Article · .NET
How to Reduce GC Pressure in .NET Applications Effectively
Reduce .NET Garbage Collection (GC) pressure for optimal performance! Learn practical strategies to minimize allocations, optimize code, and boost application speed.
- Article · ASP.NET Core
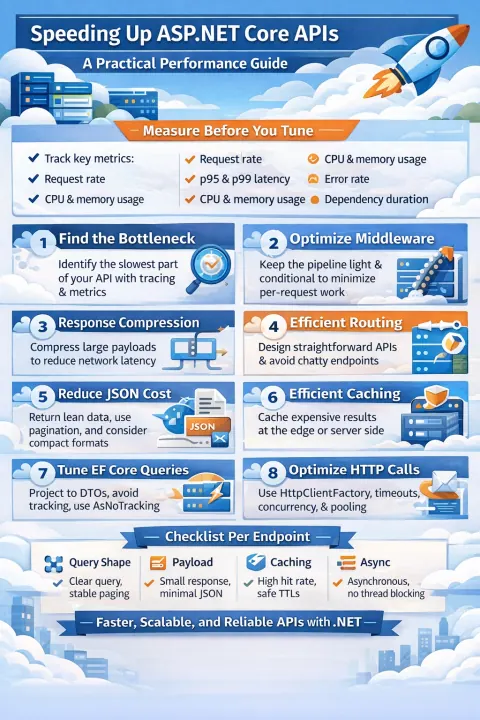
How Do I Improve Performance in ASP.NET Core APIs?
Learn how to speed up ASP.NET Core APIs with real engineering techniques covering middleware, routing, JSON, EF Core, caching, async, concurrency, logging, HTTP, and deployment tuning, with code examples and a production checklist.