Loading
Topic
Funnel Chart
1 post about Funnel Chart by 1 contributor.
Know Funnel Chart? Share what you know with developers who are learning it.
+ Follow Funnel ChartBe the first to follow this
- Articles
- 1
- Contributors
- 1
Everything about Funnel Chart
- Article · Power BI
Create and Use Funnel Charts in Power BI
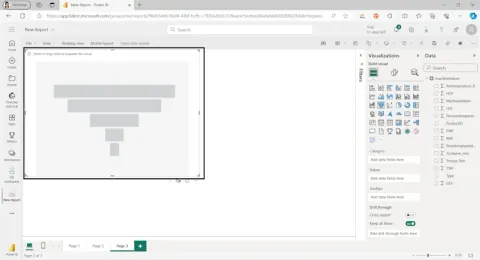
A funnel chart helps you visualize a linear process that has sequential, connected stages. A funnel chart in Power BI illustrates user flow through a process. Follow the steps to create one: connect data, locate the funnel chart, and add categories and values. Enhance business insights with visuals.