Loading
Topic
Google Chart
7 posts about Google Chart by 7 contributors.
Know Google Chart? Share what you know with developers who are learning it.
+ Follow Google ChartBe the first to follow this
- Articles
- 7
- Contributors
- 7
Everything about Google Chart
- Article · Python
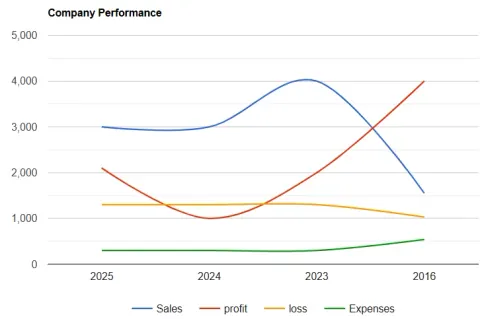
Django Web framework Google Chart Example
Django, a Python web framework using the MVT pattern, simplifies web development with built-in admin, structured views, and templates—demonstrated using a Google Charts example for dynamic data visualization.
- Article · Angular
Google Chart In Angular
In this article, you will learn about google chart in angular.
- Article · ASP.NET
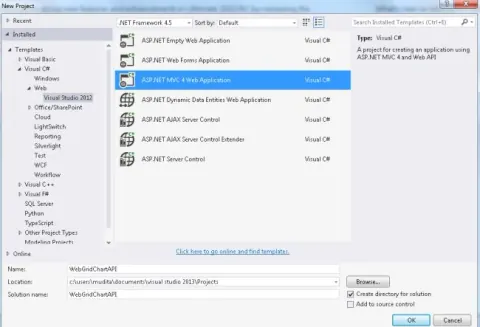
Bind A Google Chart With WebGrid in Web API
This article describes how to bind Google Chart in a WebGrid.
- Article · ASP.NET Core
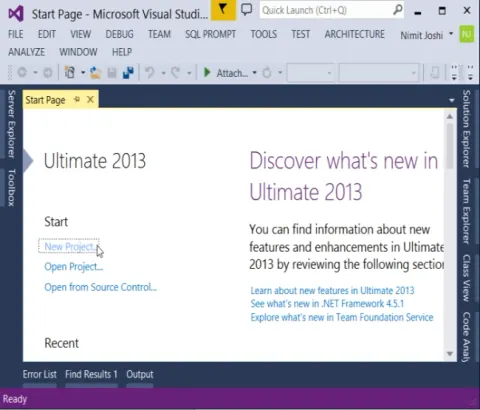
Google Chart With ASP.NET Core And Visual Studio Code
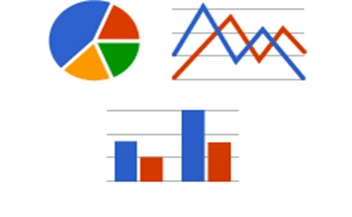
The Google Chart API lets you dynamically generate charts with a URL string and embed these charts on a web page, or download the image for local or offline use. The Google Chart Tools enable adding live charts to any web page. They provide advantages such as a rich gallery of visualizations provided as image charts and interactive charts and they can read live data from a variety of data sources. Users embed the data and formatting parameters in an HTTP request, and Google returns a PNG image of the chart. Many types of chart are supported, and by making the request into an image tag the chart can be included in a web page.
- Article · ASP.NET
Implement Google Chart Types In Real Time Scenarios Using ASP.NET MVC
In this article, you will learn how to implement Google chart types in real time scenarios, using ASP.NET MVC.
- Article · ASP.NET
Introducing Google Chart In ASP.NET MVC 5
in this article you will learn to apply Google Chart in an ASP.NET MVC 5 application.