Loading
Topic
Graphical Representation
3 posts about Graphical Representation by 3 contributors.
Know Graphical Representation? Share what you know with developers who are learning it.
+ Follow Graphical RepresentationBe the first to follow this
- Articles
- 3
- Contributors
- 3
Everything about Graphical Representation
- Article · SharePoint
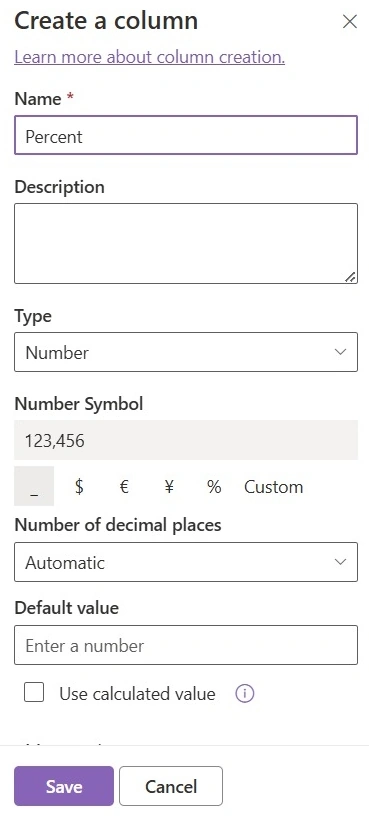
How to Create Field Customizer Extension
Extensions are client-side components that run inside the context of a SharePoint page. Extensions can be deployed to SharePoint Online, and you can use modern JavaScript tools and libraries to build them.
- Article · DirectX
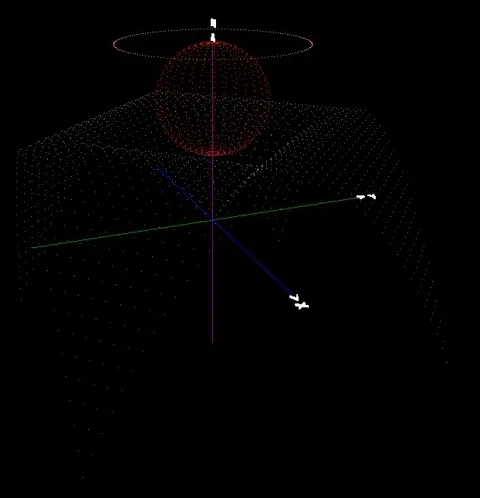
Graphical Matrix Representation
Graphical Matrix Representation" refers to visualizing matrices in a graphical format, aiding in the understanding of complex data structures. This approach is widely used in fields like graph theory, linear algebra, and data visualization to represent relationships, networks, and adjacency matrices.
- Article · Angular
How To Use Chart.js in AngularJS?
Integrate Chart.js with AngularJS to create dynamic data visualizations. Set up your AngularJS project, including Chart.js, and build various charts like bar, pie, line, stacked bar, and heat map using sample financial data. Customize the appearance and enhance your web app with interactive charts.