Loading
Topic
Interactive Charts
3 posts about Interactive Charts by 3 contributors.
Know Interactive Charts? Share what you know with developers who are learning it.
+ Follow Interactive ChartsBe the first to follow this
- Articles
- 3
- Contributors
- 3
Everything about Interactive Charts
- Article · HTML 5
How to Make Serial Chart With JSON Data Using amChart
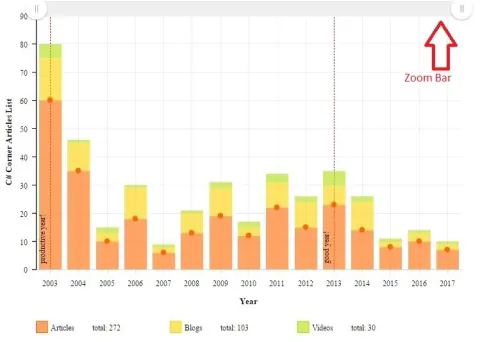
This article demonstrates how to use amCharts to display JSON data in a serial layout. It walks through the steps of adding an HTML container, referencing JavaScript libraries, creating a JSON data file, and configuring the chart with various properties such as category fields and value axes.
- Article · JavaScript
HighChart in JavaScript
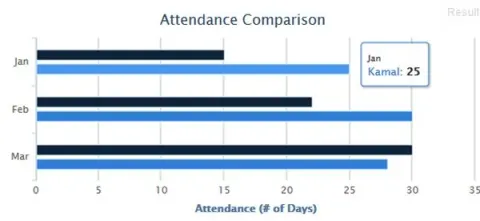
This article introduces Highcharts, a JavaScript library for creating interactive charts. It covers installation using Highcharts.js and jQuery, and provides a step-by-step guide to creating a bar chart for employee attendance. The tutorial includes code snippets and a link to a live implementation.
- Article · Angular
How To Use Chart.js in AngularJS?
Integrate Chart.js with AngularJS to create dynamic data visualizations. Set up your AngularJS project, including Chart.js, and build various charts like bar, pie, line, stacked bar, and heat map using sample financial data. Customize the appearance and enhance your web app with interactive charts.