Loading
Topic
JavaScript Charts
3 posts about JavaScript Charts by 3 contributors.
Know JavaScript Charts? Share what you know with developers who are learning it.
+ Follow JavaScript ChartsBe the first to follow this
- Articles
- 3
- Contributors
- 3
Everything about JavaScript Charts
- Article · PHP
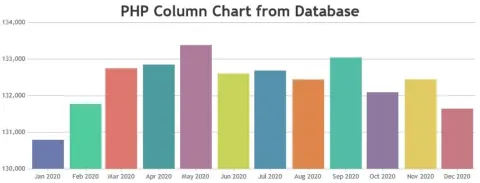
Visualizing MySQL Date-Time Data with CanvasJS in PHP
Learn how to create CanvasJS charts using date-time values from a database in PHP. This comprehensive guide covers setting up your database, fetching data, converting PHP timestamps to JavaScript timestamps, and rendering interactive charts