9 posts about Kubernetes monitoring by 7 contributors.
Know Kubernetes monitoring? Share what you know with developers who are learning it.
Learn how Kubernetes uses cgroup v2 for container CPU and memory limits, and how to inspect cgroup files to troubleshoot throttling, usage, and OOM events.

Learn how Kubernetes 1.37 native histograms improve Prometheus latency metrics while supporting existing dashboards and observability workflows.
Learn how to migrate .NET application monitoring to the Kubernetes 1.37 metrics.k8s.io API, covering resource metrics, monitoring architecture, compatibility, and migration steps.
Learn how Grafana Alloy collects metrics, logs, and traces to build scalable observability pipelines for cloud-native and distributed systems.
Unlock vendor-neutral observability with the OpenTelemetry Collector. Build scalable pipelines for logs, metrics, and traces.
Monitor Kubernetes with Prometheus & Grafana! Get real-time insights into cluster health, performance, and resource usage. Detect issues before users notice!
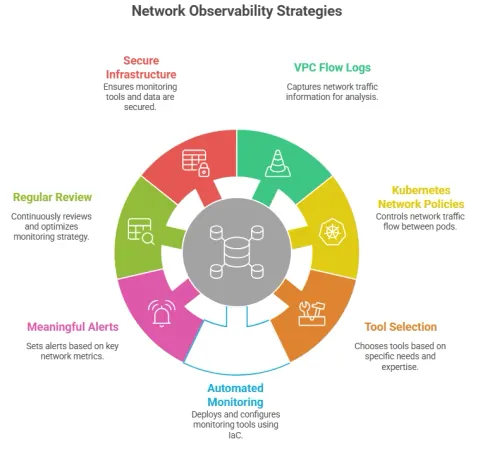
Learn how to improve network observability in Amazon EKS using monitoring tools, VPC Flow Logs, network policies, alerts, and performance optimization practices.
Unlock real-time system insights with Prometheus and Grafana! This guide explores their features, use cases, and best practices for effective monitoring. Essential for modern observability.
Publish an article in this category and earn +1,000 SHARP when it is approved.
Write an article