Loading
Topic
pie
5 posts about pie by 4 contributors.
Know pie? Share what you know with developers who are learning it.
+ Follow pieBe the first to follow this
- Articles
- 5
- Contributors
- 4
Articles about pie
- Article · Power BI
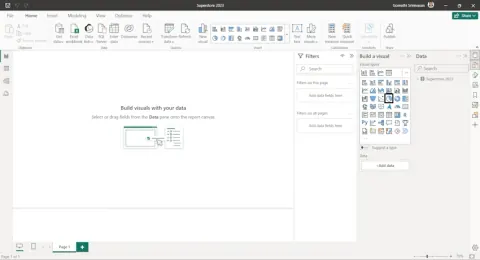
What Is Pie Charts in Power BI Report
Pie charts are most commonly used to make comparisons between groups. Pie charts, though visually impactful, are best used when data is aggregated to seven points or fewer. Follow these steps using Power BI Desktop to create effective and insightful pie charts.
- Article · GDI+ in VB.NET
Drawing Pie Shapes in GDI+
In this article I will explain you how to Draw Pie Shapes in GDI+.
- Article · GDI+
Drawing Pie Shapes in GDI+
In this article I will explain you how to Draw Pie Shapes in GDI+.
- Article · Visual Basic 2010
Working with GDI+ Brushes using VB.NET
You can create different types of brushes in GDI+. In this article, I will show you how to create various types of brushes.