Loading
Topic
Plot
2 posts about Plot by 2 contributors.
Know Plot? Share what you know with developers who are learning it.
+ Follow PlotBe the first to follow this
- Articles
- 2
- Contributors
- 2
Everything about Plot
- Article · Python
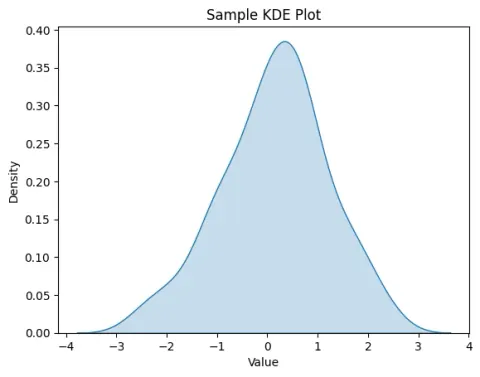
Data Distributions with Seaborn: Creating a KDE Plot
I'll guide you through the process of creating a Kernel Density Estimate (KDE) Plot using Seaborn, a powerful Python visualization library.
- Article · GDI+
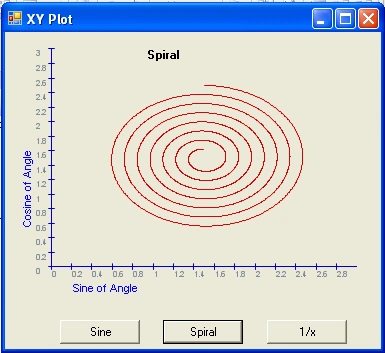
Latest XY-Plot Control
This is an rewrite of the XY-Plot control. It fixes some issues such as the y-axis label, smoother plotting of points, axis with tick mark values that make sense, and more. (Updated for VS2008)