Loading
Topic
Plot in Python
1 post about Plot in Python by 1 contributor.
Know Plot in Python? Share what you know with developers who are learning it.
+ Follow Plot in PythonBe the first to follow this
- Articles
- 1
- Contributors
- 1
Everything about Plot in Python
- Article · Python
Top 10 Matplotlib Functions Every Data Analyst Should Know
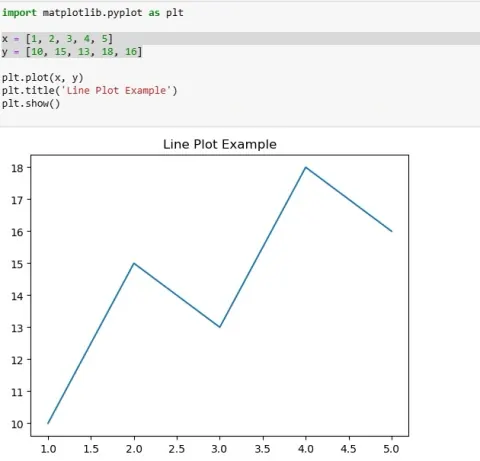
Unlock the power of Python data visualization with this quick articleto the top 10 Matplotlib functions every data analyst should know. From plot() to subplot(), learn how to create line charts, bar graphs, histograms, and more — with clear examples to get you started fast.