Loading
Topic
Python Visualization
2 posts about Python Visualization by 2 contributors.
Know Python Visualization? Share what you know with developers who are learning it.
+ Follow Python VisualizationBe the first to follow this
- Articles
- 2
- Contributors
- 2
Everything about Python Visualization
- Article · Python
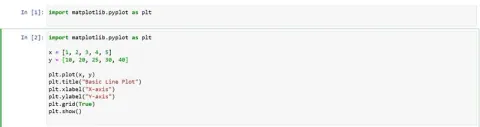
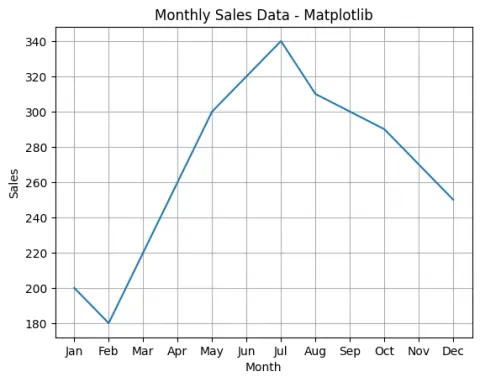
Mastering Data Visualization with Matplotlib in Python
Learn how to turn raw data into powerful visuals using Matplotlib, Python’s go-to library for data visualization. A must-read for beginners in data science and analytics.