Loading
Topic
report design
9 posts about report design by 3 contributors.
Know report design? Share what you know with developers who are learning it.
+ Follow report designBe the first to follow this
- Articles
- 9
- Contributors
- 3
Articles about report design
- Article · Power BI
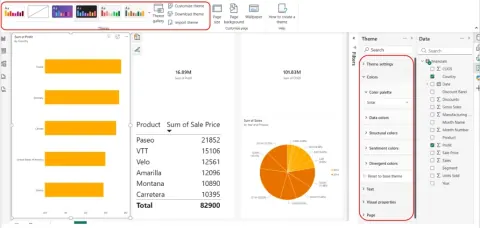
New Design Ribbon and Dark Theme for Power BI Reports
Learn how Power BI's Design ribbon centralizes report themes, page size, backgrounds, wallpaper, and light or dark appearance settings.
- Article · Power BI
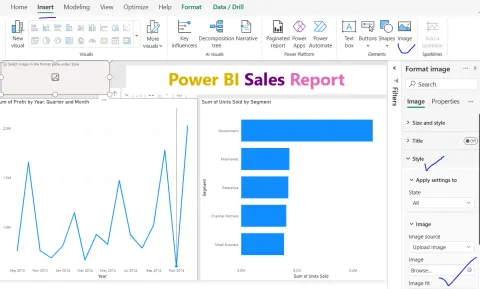
How to Insert an Image into a Power BI Report
Learn how to insert images into Power BI reports to enhance visual appeal, branding, and user experience. Discover best practices for optimal performance and design.
- Article · Power BI
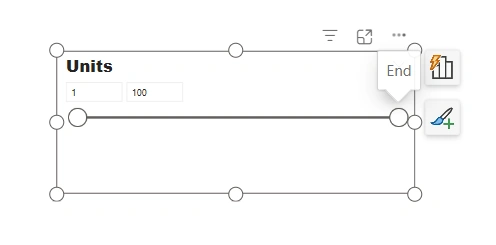
Different Types of Slicers in Power BI – A Complete Guide
In this article, you will master Power BI slicers! This guide explores list, dropdown, range, relative date, before/after slicers, and more. Create interactive, user-friendly dashboards.
- Article · Power BI
How to Maintain Power BI Reports Long-Term Without Rewrites
Learn how to keep Power BI reports maintainable through reusable measures, simpler visuals, clear naming, documented ownership, and regular review cycles.
- Article · Power BI
How to Design Power BI Reports Executives Actually Use
Boost executive Power BI adoption! Learn to design reports that focus on decisions, clarity, and speed. Drive strategic insights and data-driven leadership.
- Article · Power BI
Why Business Users Stop Trusting Power BI Reports
Discover why business users lose faith in Power BI reports. Learn to avoid mismatched data, confusing designs, and performance issues to build trustworthy dashboards.
- Article · Power BI
How to Prevent Power BI Performance Issues Before They Start
Proactive Power BI performance tuning is key! Learn how to prevent slow dashboards by focusing on data models, DAX, visuals, refresh, and capacity planning early.
- Article · Power BI
Power BI Report Design Mistakes That Confuse Users
Avoid Power BI report design flaws that frustrate users! Learn to create clear, effective dashboards with best practices for visuals, filters, and data presentation.
- Article · SQL Server
SSRS (RDL) Report Design Using Microsoft Report Builder
This article describes how to design SSRS reports using Microsoft Report Builder