Loading
Topic
Table visualization
1 post about Table visualization by 1 contributor.
Know Table visualization? Share what you know with developers who are learning it.
+ Follow Table visualizationBe the first to follow this
- Articles
- 1
- Contributors
- 1
Articles about Table visualization
- Article · Power BI
Conditional Formatting By Data Bar In Power BI
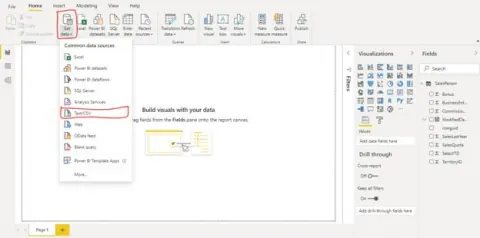
Learn how to implement conditional formatting with data bars in Power BI. Import data from CSV, select the table visualization, and choose the column for formatting. Set minimum and maximum values, select colors, and apply formatting. Improve data representation for better understanding.