Loading
Topic
visualisations
2 posts about visualisations by 2 contributors.
Know visualisations? Share what you know with developers who are learning it.
+ Follow visualisationsBe the first to follow this
- Articles
- 2
- Contributors
- 2
Articles about visualisations
- Article · JavaScript
Drawing a Heatmap Using D3.js
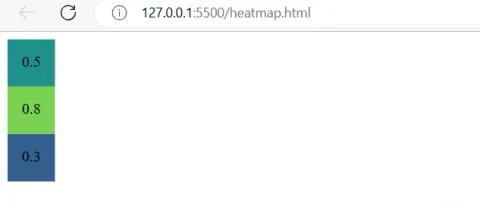
Heatmaps are powerful visual representations that can help us analyze and understand patterns in data. They provide a graphical representation of data where the values are represented by colors. In this article, we will explore how to create a heatmap using D3.js, a popular JavaScript library for data visualization.
- Article · HTML 5
Explore Generating Visualisations Using JavaScript in HTML5
In this article we will show the visualisations effects with the help of the JavaScript in HTML5 canvas.