Loading
Tuhin Paul's contributions
Build a Log Aggregator with Structured JSON Parsing Using Python
Build a Python log aggregator that parses JSON log entries, filters them by fields such as service and level, and formats matching results for the terminal.
Compute FFT for Audio Pitch Detection: Real-Time Vocal Coach for Singers Using Python
Build a real-time Python vocal coach that captures microphone audio, uses FFT to detect pitch, and maps frequencies to musical notes for live feedback.
Compute FFT for Audio Pitch Detection: Real-Time Guitar Tuner in Python
Build a Python guitar tuner that analyzes WAV audio with FFT to detect dominant frequencies and map them to musical notes.
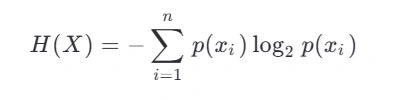
How to Compute the Shannon Entropy of a Data Stream Using Python
Discover how to calculate Shannon entropy on live data streams using Python for real-time anomaly detection. This article provides a step-by-step guide with code examples, focusing on cybersecurity applications like detecting malware beaconing through domain name analysis. Learn to efficiently compute entropy incrementally, identify suspicious patterns, and enhance your security posture with information theory. Includes practical test cases and performance tips.
How to Animate a Heatmap of City Foot Traffic Using GPS Pings Using Python
Unlock urban insights by animating foot traffic heatmaps using Python! This guide simulates realistic GPS data around Shibuya Station, Tokyo, and visualizes pedestrian movement over time. Learn to build interactive heatmaps with Folium and Matplotlib, revealing temporal density changes for city planning, retail analysis, and emergency response.
Smoothing Drone Telemetry in Real Time with Exponential Moving Average Using Python
Drones rely on accurate sensor data for stable flight, but this article demonstrates how to implement an Exponential Moving Average (EMA) in Python for real-time smoothing. Learn how EMA filters noise, preserves responsiveness, and improves flight stability with efficient code, live simulation, and best practices for embedded systems.
How to Create an Interactive Sankey Diagram for Energy Flow in Smart Grids Using Python
Visualize smart grid energy flow in real-time using Python and Sankey diagrams! This guide provides a step-by-step approach to building an interactive dashboard with Plotly, simulating a European grid responding to a heatwave. Learn to identify inefficiencies, optimize resource allocation, and gain actionable insights for grid operators. Discover best practices for dashboard design and real-world applications.
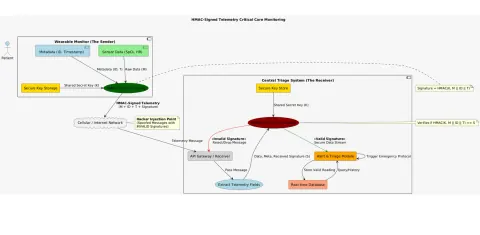
How to Implement HMAC-Based Message Authentication Using Python
Learn how to implement HMAC (Hash-based Message Authentication Code) in Python to secure your data and ensure message integrity. This tutorial provides a step-by-step guide, complete with a real-world simulation of securing IoT medical device telemetry during a pandemic. Discover best practices for production systems, including key rotation, context binding, and secure key management, to protect against tampering and spoofing attacks.
How to Visualize Network Latency Across Global CDN Nodes Using Python
Visualize global CDN latency in real-time using Python, Plotly, and public endpoints. This tutorial guides you through building an interactive map to identify underperforming regions, validate CDN performance, and proactively trigger failovers. Learn to measure latency, map IPs to locations, and simulate live updates for optimal user experience. Perfect for live streaming and global applications!
Detecting Deepfake Images in Real Time Using Earth Mover’s Distance Using Python
This article provides a practical guide to detecting AI-generated image manipulation by analyzing subtle histogram differences. Learn how to implement EMD with SciPy for efficient deepfake detection and content moderation. Protect your platform from misinformation by leveraging EMD's sensitivity to statistical anomalies in image intensity profiles.
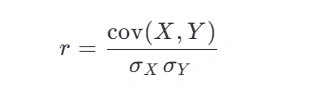
How to Calculate the Pearson Correlation Coefficient in Real Time Using Python
Unlock real-time insights with Pearson Correlation! This article provides a practical Python implementation for calculating the Pearson Correlation Coefficient on streaming data. Learn how to analyze live data, like NBA game stats, with an efficient online algorithm. Discover best practices for numerical stability, performance optimization, and handling edge cases. Get instant answers to critical questions in sports analytics, finance, and more!
How to Render a Live Order Book Depth Chart for a Trading Platform Using Python
Unlock real-time market insights by building a live, animated order book depth chart in Python. This guide simulates cryptocurrency order book data, visualizing bid/ask liquidity with Matplotlib. Learn to spot hidden orders, anticipate slippage, and gain a competitive edge in high-frequency trading.
Real-Time Outlier Detection in ICU Patient Monitoring Using Streaming IQR Using Python
Detect anomalies in real-time ICU patient monitoring using streaming Interquartile Range (IQR) in Python. This article provides a practical guide to implementing IQR-based outlier detection on live data streams, crucial for identifying critical events and reducing false alarms. Learn how to adapt IQR for streaming data using reservoir sampling, ensuring timely and accurate alerts in critical care environments.
Real-Time Correlation for Live Pair Trading: Building a Streaming Signal Engine Using Python
Learn to calculate Pearson correlation continuously from streaming price returns in Python and use the result to detect pair-trading divergences with an O(1) online algorithm.
Building a Real-Time Candlestick Chart for Live Crypto Trading Using Python
Build a real-time Python candlestick chart from simulated crypto price ticks. Learn to aggregate streaming data into OHLC candles and update a Matplotlib dashboard.
Decoder Program for Secure Cipher Text using Python
Explore secure decryption with Python using AES-GCM. This article provides a production-ready decoder implementation, emphasizing the critical role of decryption in maintaining data integrity and preventing malicious attacks. Learn best practices for safe decryption, including validation, nonce handling, and secure key storage. Understand how a robust decoder ensures trust in high-stakes environments, protecting decisions in action.
How to Find GINI Coefficient: Measuring Economic Inequality in a Smart City in Python
Unlock economic insights in smart cities! This guide teaches you how to calculate the GINI coefficient using Python, a crucial metric for measuring income inequality. Learn to analyze real-world data, like ride-hailing earnings in Austin, and implement ethical considerations for fair urban planning. Detect inequality, trigger alerts, and build equitable cities with this practical, code-driven approach. Start measuring and balancing your city's social fabric today!
How to Determine if Three Numbers Are in AP, GP, or HP using Python
Discover how to identify Arithmetic (AP), Geometric (GP), and Harmonic Progressions (HP) in Python. This guide provides a practical, error-free implementation for real-world applications like sensor data analysis in smart agriculture. Learn to detect anomalies and predict system behavior using mathematical conditions and best practices for edge case handling, turning abstract math into actionable insights. Improve your anomaly detection skills!
How to Find the Histogram of a 256-Grayscale Image using Python
This article teaches you how to compute a 256-grayscale histogram in Python without external libraries. Learn how histograms drive auto-exposure, defect detection, and adaptive processing in systems like autonomous robots. Discover a real-world use case where histogram analysis saves crops by enabling night vision calibration, improving accuracy by 62% with a simple 256-integer array.
Animation of Different Signalling Formats using Python
Unlock the power of visual signal analysis with Python! This article demonstrates how to animate NRZ, Manchester, and Differential Manchester signalling formats using matplotlib. Learn to debug real-time systems like train control with intuitive visualizations, revealing timing errors and protocol violations. Turn raw data into actionable insights and build your own signal observability tool in just 50 lines of code. See the signal, save time, and enhance safety!
A Well-Known Cryptographic Technique: Cipher Text Using Python
Explore cipher text, the cornerstone of digital security, with a real-world example of securing drone medical deliveries in Rwanda. This article demystifies encryption using AES-GCM in Python, providing error-free code and best practices for safeguarding sensitive data. Learn how to protect against data breaches and ensure data integrity in today's connected world.
How to Convert a Grayscale Image to Binary or Negative Image Using Python
Learn how to convert grayscale NumPy arrays into binary images using a threshold and create negative images by inverting pixel values in Python.
How to Return More Than One Value from a Function in Python
Unlock Python's power to return multiple values from functions! This guide explores tuples, named tuples, and dataclasses for efficient and readable code. Learn how to return heart rate, SpO2, and signal quality from a wearable device simulation. Discover best practices for maintainability, testing, and performance. Improve your Python skills today!
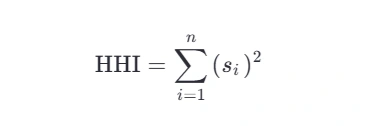
How to Calculate the Herfindahl-Hirschman Index (HHI) in Python: Monitoring Market Competition in Real Time
Learn how to calculate the Herfindahl-Hirschman Index (HHI) in Python to monitor market competition in real-time. This guide provides a step-by-step implementation with realistic test cases, focusing on a scenario involving anti-competitive mergers in the EV battery market. Discover best practices for using HHI in policy and business to detect monopolistic risks and ensure fair markets. Automate alerts and gain insights into market concentration.
Representing a Sparse Matrix as Arrays in Python
Learn how to efficiently represent sparse matrices using arrays in Python, crucial for handling large datasets with mostly zero values. Explore Coordinate (COO), Compressed Sparse Row (CSR), and Compressed Sparse Column (CSC) formats. Includes practical examples, a complete Python implementation with test cases, and performance tips for social network analysis and other real-world applications. Optimize memory usage and computation speed!