Loading
Topic
Chart Creation
2 posts about Chart Creation by 2 contributors.
Know Chart Creation? Share what you know with developers who are learning it.
+ Follow Chart CreationBe the first to follow this
- Articles
- 2
- Contributors
- 2
Everything about Chart Creation
- Article · JavaScript
Creating Bar Chart From D3JS Using JSON Data
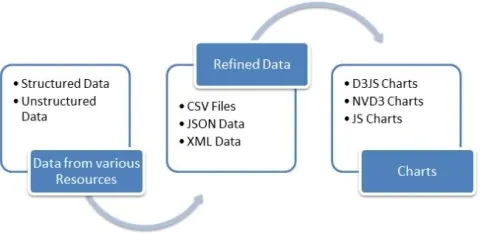
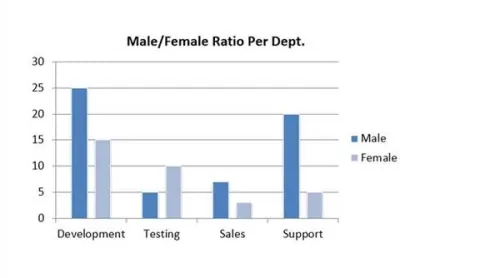
This article explores using JSON data with D3JS for creating various charts to meet application needs. It covers an overview of D3JS, common problems in data visualization, and provides practical solutions with code snippets in HTML, JavaScript, and CSS.
- Article · C#
Create Charts In PowerPoint Using C#
Discover how to leverage the .NET Presentation library in C# to create column, pie, and combination charts for effective data visualization in PowerPoint. Enhance presentations with clear, insightful graphical representations, facilitating data-driven insights and comparisons across different chart types.