Loading
Topic
Column Chart
8 posts about Column Chart by 8 contributors.
Know Column Chart? Share what you know with developers who are learning it.
+ Follow Column ChartBe the first to follow this
- Articles
- 8
- Contributors
- 8
Everything about Column Chart
- Article · C#
Create Charts In PowerPoint Using C#
Discover how to leverage the .NET Presentation library in C# to create column, pie, and combination charts for effective data visualization in PowerPoint. Enhance presentations with clear, insightful graphical representations, facilitating data-driven insights and comparisons across different chart types.
- Article · Power Apps
Filter PowerApps Gallery with Column Chart Selection
In this article, explore how to enhance PowerApps with interactive features. Learn to synchronize column chart selections to filter galleries seamlessly for a more dynamic user experience.
- Article · C#
Create Various Types of Charts in Word Documents in C# and VB.NET
By creating charts in your Word document, you can enhance the impact of your content and make it more engaging and informative for your readers. In this article, we will explore how to create Column Chart, Line Chart, Pie Chart, Bar Chart, Scatter Chart, Bubble Chart, 3D Surface Chart in a Word document using C# and VB.NET.
- Article · Power BI
Getting Started With Stacked Bar Chart
In this article, you will learn about Stacked Bar Chart.
- Article · WPF
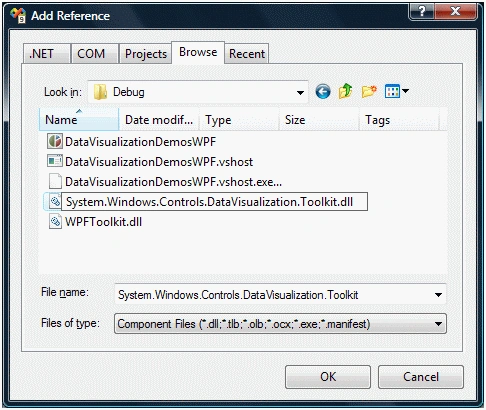
Column Chart In WPF
This article demonstrates how to draw column charts using WPF and C#.
- Article · UWP
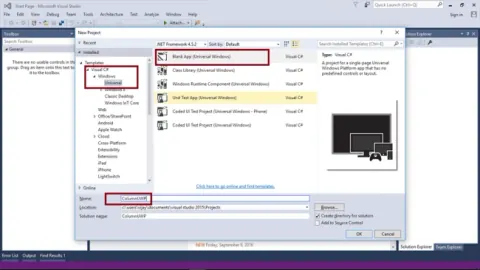
Creating Column Chart In Universal Application Development With XAML And C#
In this article, you will learn, how to create column chart in Universal Windows apps development with XAML and Visual C#.
- Article · ASP.NET
Charts For ASP.NET MVC Application
In this article we will see how to create various charts like Line, Column, Area and Pie for ASP.NET MVC applications.