Loading
Topic
Gantt Chart
1 post about Gantt Chart by 1 contributor.
Know Gantt Chart? Share what you know with developers who are learning it.
+ Follow Gantt ChartBe the first to follow this
- Articles
- 1
- Contributors
- 1
Everything about Gantt Chart
- Article · Power BI
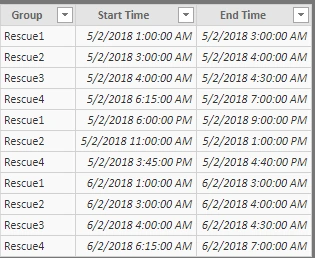
Create Gantt Chart To Show Duration Between Start Time And End Time Using R Within Power BI
This article covers how we can create a Gantt Chart using R script visualization. A Gantt chart is used to represent the duration between a start time and end time. Here, I have created a Gantt Chart to represent the time between start time and end time in hours.