Loading
Abiola David's contributions
- Article · Power BI
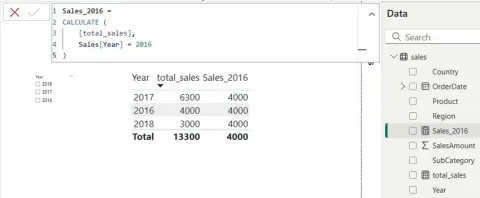
Best Practices for using KEEPFILTERS DAX Function
IEfficiently calculate total sales for the United States and Canada in Power BI using CALCULATE with KEEPFILTERS and IN operator, ensuring accurate results while preserving filter context.
- Article · Python
Pandas and Polars: Which Python Data Library Should You Choose?
Explore the key differences between Pandas and Polars—two powerful Python libraries for data processing. Learn when to use each for speed, scale, and efficiency in modern data workflows.
- Article · Power BI
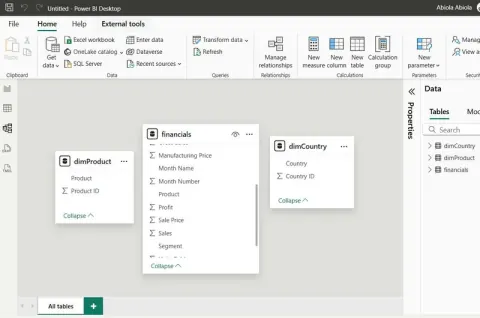
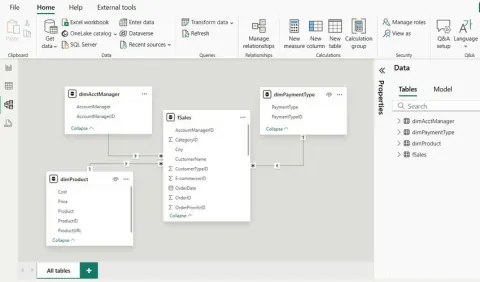
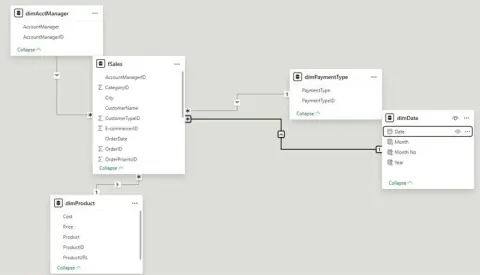
Creating and Using Relationships in Power BI: A Practical Guide
This article explains how Power BI relationships connect tables for cleaner data models, enabling accurate, interactive reports. Learn types, benefits, and how to create relationships for smarter data analysis.
- Article · Microsoft Fabric
Cost Implications of Mirroring Azure Databricks Unity Catalog Data into Microsoft Fabric
This article explains the cost implications of mirroring Unity Catalog data from Azure Databricks to Microsoft Fabric, helping you plan and optimize data architecture with minimal surprises.
- Article · Microsoft Fabric
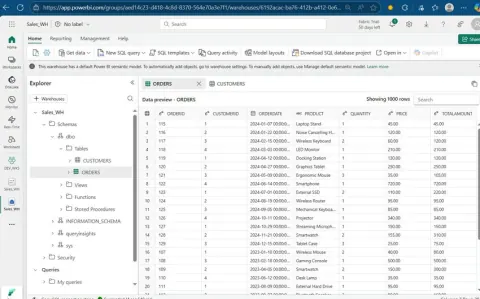
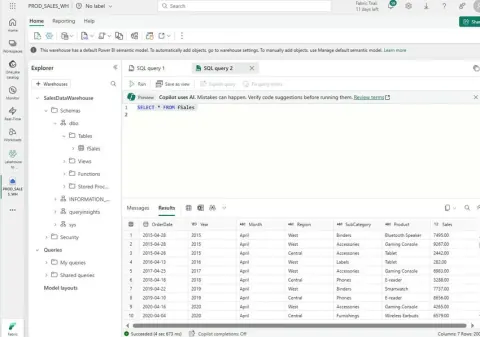
Creating a Semantic Model in Microsoft Fabric Warehouse
Transform raw warehouse tables into business-friendly insights using semantic models in Microsoft Fabric Warehouse. Enable self-service analytics, Power BI integration, and centralized data modeling with ease.
- Article · Microsoft Fabric
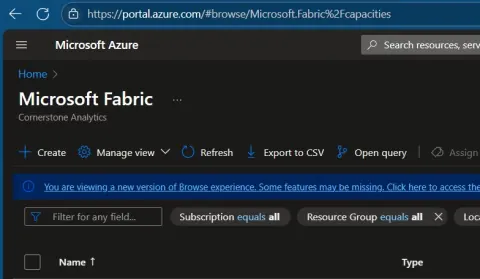
Creating Fabric F64 Capacity: A Guide for Data Engineers
Learn how to create and manage F64 capacity in Microsoft Fabric. This step-by-step guide helps data engineers scale workloads, optimize performance, and unlock enterprise-level analytics.
- Article · Microsoft Fabric
Mastering PySpark's EXPLODE Function in Fabric Notebooks
Learn how to master the EXPLODE function in PySpark using Microsoft Fabric Notebooks. This guide simplifies how to transform nested arrays or maps into separate rows for easier analysis.
- Article · Microsoft Fabric
Microsoft Fabric Warehouse Integration in VS Code for Devs
Experience seamless development with Microsoft Fabric and VS Code integration. Write, debug, and manage SQL queries directly in your editor, connect to Fabric Warehouse, and boost productivity with real-time data access.
- Video · Databricks
Automation: Publish to Power BI Online from Azure Databricks
In this video, I will show you how to seamlessly publish your Azure Databricks data directly to Power BI Online, eliminating the need for complex export-import workflows. You'll learn how to configure the necessary permissions, set up Unity Catalog integration, and publish datasets with just a few clicks, saving you valuable time in your data analytics process
- Article · Power BI
Mastering the Power of Calendar Tables in Power BI with ADDCOLUMNS in DAX
This article covers creating dynamic, customizable date tables for advanced time intelligence, enabling better reporting, filtering, and analysis in your Power BI dashboards.
- Video · Microsoft Fabric
Managed and External Tables in Databricks
In this video, I dive deep into creating Managed and External Tables in Databricks, blending theory with practical examples to provide a comprehensive understanding. Whether you're building robust data pipelines or exploring database management, this guide equips you with essential skills for effective implementation.
- Article · Power BI
Mastering Power BI Time Intelligence DAX: YTD, QTD, MTD, % of Total, YOY & More
Master essential Time Intelligence DAX functions in Power BI to analyze trends, compare year-over-year data, and build dynamic, time-aware reports that drive smarter business decisions and insights.
- Video · Microsoft Fabric
Workspace Identity in Fabric Data Pipeline and Lakehouse Shortcuts
In this video, I showcase how to use workspace identity in the Fabric Data Pipeline and explore Lakehouse shortcuts. This demonstration includes configuring workspace identity for seamless access control across data pipelines, enhancing collaboration and security within Fabric. Additionally, I delve into how Lakehouse shortcuts can streamline data access, providing users with efficient pathways to navigate large datasets and improve productivity in data engineering workflows.
- Article · Microsoft Fabric
Modern Data Wrangling with Polars and Delta Lake in Microsoft Fabric
Learn how to efficiently clean, transform, and manage large datasets with high-performance tools. Discover scalable, fast, and flexible data workflows designed for today’s data engineering needs.
- Video · Power BI
Load Tasks from Microsoft Planner to Power BI using Power Automate
In this video, I showcase how to technically load tasks from Microsoft Planner to Power BI for analysis and visualization
- Article · Power BI
Bring Your Data From Azure Data Lake Storage Gen2 to Power BI
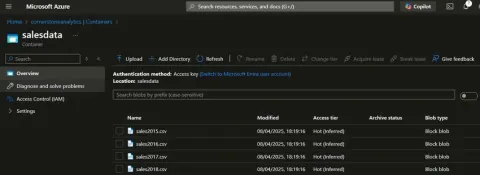
Connect Power BI Desktop to Azure Data Lake Storage Gen2, combine CSV files in Power Query, transform the data, and create a sales report.
- Article · Microsoft Fabric
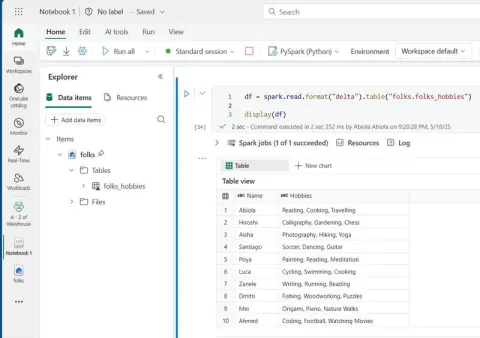
Viewing the Content of Spark DataFrames in Fabric Notebook
Discover techniques to preview, filter, and analyze large datasets using Apache Spark. Whether you're working with PySpark or big data processing, enhance your workflow with efficient DataFrame visualization.
- Video · Databricks
Make Predictions using AI Forecast Function in Databricks
In this new video, I showcase how organizations can leverage the power of Databricks SQL Warehouse's AI_Forecast function to generate accurate predictions, empowering informed business decisions in budgeting, resource allocation, and strategic planning.
- Article · Microsoft Fabric
Creating DataFrames in PySpark Using Fabric Notebook
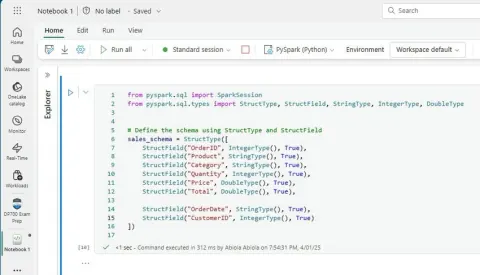
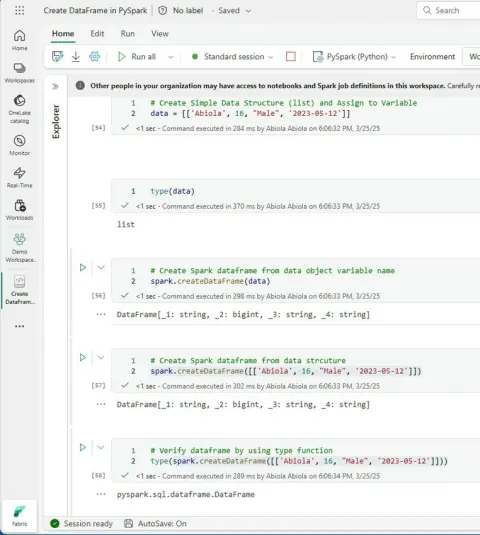
This article walks through defining schemas, specifying column names, and using SQL-like DDL in a Fabric Notebook. Explore StructType, StructField, and various ways to display and verify DataFrame content efficiently.
- Video · Databricks
Databricks FileStore to SQL Warehouse [Automation]
In this Databricks episode, I demonstrated how to implement an automated solution that ingest sales data stored locally into the Databricks DBFS Failestore, read and write the data into a table attached to SQL Warehouse and built AI/BI Dashboard for downstream reporting.
- Video · Microsoft Fabric
DP700 Exam Prep, Row-Level Security in Fabric Warehouse
Exciting news! In my latest video on DP700 Exam Prep, I dive deep into implementing Row-Level Security (RLS) in Fabric Warehouse. This topic is part of the "Securing and Managing Analytics Solution" skill measured in the Microsoft Certified Fabric Data Engineer exam.
- Video · Databricks
Real-Time Streaming Data in Databricks [End to End Project]
??In this comprehensive end-to-end data engineering video, I demonstrated how to architect real-time streaming data solutions in Databricks, starting from weather data captured in VS Code, seamlessly integrated with Azure Event Hubs. The setup leverages the robust capabilities of the Medallion Architecture and the advanced features of Unity Catalog to ensure efficient data management and processing.In this video, you will learn how to: ?? Create Event Hubs and Share Access Policies ?? Generate weather streaming data using Python in VS Code ?? Send the events to Azure Event Hubs ?? Create Databricks Cluster and Install Maven Library to authenticate access Azure EventHub ?? Create unity catalog, schemas and volumes using medallion architecture ?? Read and write streams across the bronze, silver and gold layers ??Access Power BI Desktop in Marketplace Partners Connect tab ?? Build near real-time Power BI report using DirectQuery
- Video · Microsoft Fabric
From Azure Event Hubs to Fabric RT Dashboard [Streaming Data]
I'm excited to share my latest tutorial on Real-Time Intelligence, where I walk you through how to generate data using Python, send it to Azure Event Hubs, stream it to Microsoft Fabric EventHouse, and create a real-time dashboard with Power BI. What You'll Learn in This Video: ? Data Generation – How to use Python in VS Code to generate realistic real-time data. ? Azure Event Hubs – Learn how to set up and send data for real-time processing. ? Microsoft Fabric EventStream – Stream data from Azure Event Hubs to Fabric EventStream. ? EventHouse Integration – Store and manage real-time data in EventHouse. ? Real-Time Dashboard – Build a live, interactive dashboard to visualize and analyze data. ? Power BI Report – Create a Power BI Report using streaming data.
- Video · Azure
Create Azure Event Hubs and Send Custom Payload Events
In this new video, I covered what is Azure Event Hubs, its components and a demo on how to create Azure Event Hubs service and send events using custom payload events. In the next video, I will be cover how to get data from Azure Event Hubs to KQL Database in Fabric and create real-time dashboard. Stay tuned.
- Video · Databricks
Delta Live Table Pipeline in Databricks [SQL]
In this end-to-end practical video, I covered how to implement a Databricks Delta Live Table Pipeline that seamlessly integrates with the Medallion Architecture and Star Schema data modeling technique. You will learn how to: Mount an ADLS Gen2 container. Read data from the mount point to the Bronze layer. Read, clean, and transform data from the Silver to Gold layers using SQL. Set up the DLT pipeline and run it. Interpret the DLT graph and consume data from the Hive metastore.