Loading
Abiola David's contributions
- Video · Microsoft Fabric
Programmatically Get Specific Fabric Workspace Items in Fabric Notebook
In this video, I walked you through how to programmatically get all the items from a specific workspace using Fabric Notebook.
- Video · Microsoft Fabric
SQL CTE to Rank Sales by Products using Fabric Data Warehouse
This video shows how to author Common Table Expressions in Fabric Data Warehouse to Rank Sales by Products.
- Video · Microsoft Fabric
Read JSON File to Spark DataFrame and Fabric Lakehouse for Downstream Analytics
This video shows how to read JSON file into Spark DataFrame using Fabric Notebook and how to write the the data to Fabric Lakehouse for downstream data analytics.
- Video · Microsoft Fabric
Quickly Provision Fabric Dataflow Gen2 Tables in Excel for Power Pivot Analysis
In this video, I demo how to use popular keyboard shortcut to provision multiple tables in Dataflows Gen2 in Microsoft Fabric Data Factory to Excel for data modelling in Power Pivot
- Video · Microsoft Fabric
Embed Power Report in Fabric Notebook
In this video, I demonstrated how to embed Power BI report in the Microsoft Fabric Notebook and filter the report
- Article · Microsoft Fabric
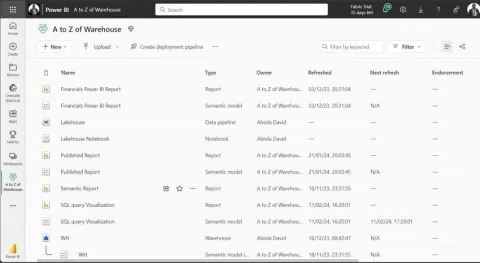
Guide to Endorsing Fabric Items: Promoting and Certifying
One of the crucial responsibilities of #FabricAdmin is ensuring high-quality and trustworthy items are endorsed either by promoting or certifying those items. In this definitive guide, I explained how to practically endorse items by promoting and certifying Fabric items.
- Video · Microsoft Fabric
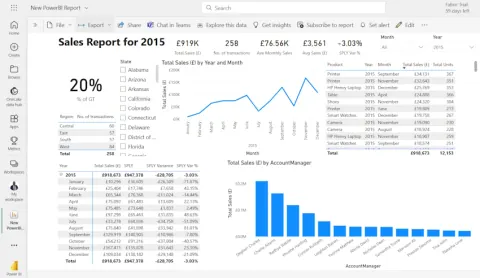
Calculating Total and Average Sales in Fabric KQL
This video shows how to calculate Total and Average Sales by Account Manager by writing Kusto Query Language code in Microsoft Fabric.
- Article · Microsoft Fabric
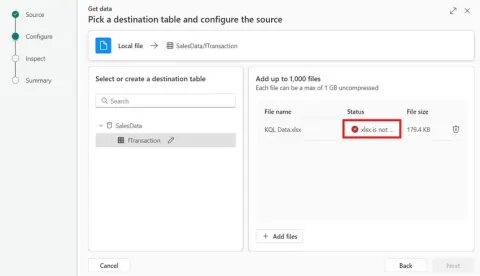
Supported File Types for Data Ingestion into KQL Database in Fabric
This article is about Understanding the Supported File Types for Data Ingestion into the KQL Database in Fabric Real-time Analytics. Supported file types include JSON, CSV, XML, & Text. Note: XLSX is not supported. See how to ingest & transform data using Data Factory.
- Video · Microsoft 365
Clean and Transform Data using M Code Stored in Text File
In this video, I showed how to clean and transform data using M code stored in Text file in excel
- Article · Microsoft 365
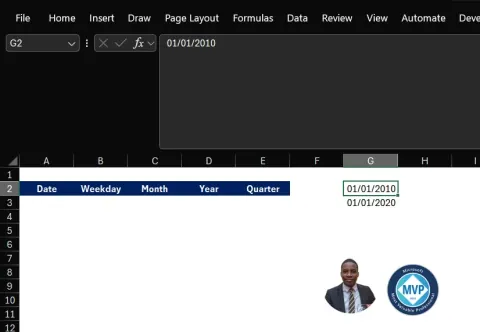
Excel Formula: Generate Random Dates and Extract Day, Month, Year, Quarter
This article shows how to Generate Randomised Dates and Extract Day, Month, Year, and Quarter using a Single Formula in Excel. Explore advanced Excel formulas using the LET function and dynamic arrays to generate 100,000 rows of randomized dates.
- Article · Microsoft Fabric
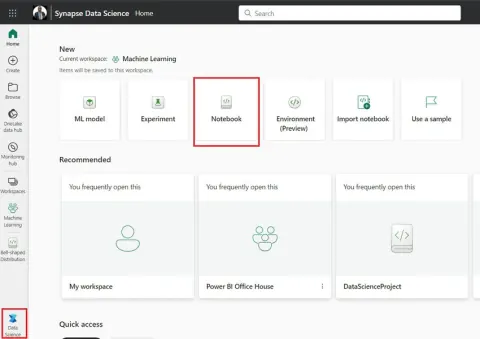
Generate Bell-Shaped Distribution: PySpark & Matplotlib in Fabric Notebook
Learn how to generate and visualize a bell-shaped or normal distribution using PySpark and Matplotlib in Microsoft Fabric Notebook. Explore the characteristics of a normal distribution, its symmetry, central tendency, and variability.
- Article · Microsoft Fabric
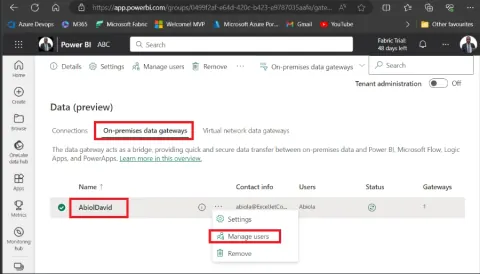
Sharing Data Gateway in Microsoft Fabric Portal with Demo
This article dives into how to share data gateway with users and resource groups in Microsoft Fabric. The Sharing Data Gateway in Microsoft Fabric Portal streamlines access and data transfer between on-premises and the cloud, promoting collaboration, optimizing resource usage and ensuring security.
- Video · Microsoft Fabric
Create Shortcuts to AWS S3 from Fabric Lakehouse
In this video, I demo how to create Shortcuts in Fabric Lakehouse from AWS s3 service. If you enjoy this video, give it a thumps up, comment and share with your friends and connection
- Article · Microsoft Fabric
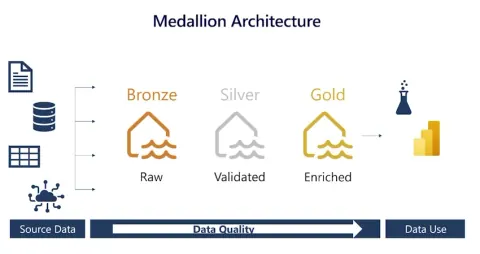
Undertanding Medallion Architecture in Microsoft Fabric Lakehouse
Learn how Medallion Architecture organizes Microsoft Fabric Lakehouse data into Bronze, Silver, and Gold layers for progressively refined analytics data.
- Video · Microsoft Fabric
How to enable CoPilot in Microdoft Fabric Admin Portal
This video shows how to enable Generative AI Copilot in Microsoft Fabric Admin Portal.
- Video · Microsoft 365
Brand New GroupBy Function with Subtotals Conditional Formatting in Excel
This video shows how to use the brand new GroupBy Function with Subtotals Conditionally Formatted in Excel.
- Article · Microsoft Fabric
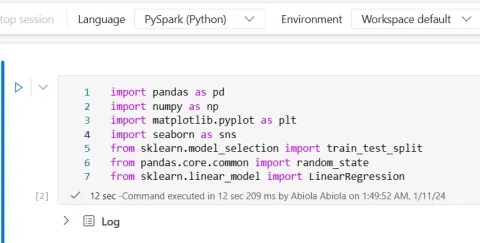
Implementing Simple Linear Regression Model in Fabric Notebook
This article dives into how to implement a simple linear regression model in Microsoft Fabric Notebook. The main goal of simple linear regression is to find the best-fitting line through the data points that minimizes the sum of the squared differences between the observed values.
- Video · Power BI
Calculating Average Sales Per Unique Product in Power BI
Average Sales per Unique Product metric is a useful tool for businesses to make informed decisions. By calculating the average sales per unique product ID, businesses can gain insights into the performance of their products and make data-driven decisions. For example, if the sales per unique product are low, it may indicate that the product is not popular among customers and needs to be improved or discontinued. This video shows how to write the DAX formula to calculate Total Sales Per Unique Product in #powerbi
- Video · Business Intelligence(BI)
Dynamic Report with Values and Percentage on Column Chart in Excel
In this Excel video, I show how to create dynamic report with values and percentage displays on the column chat.
- Video · Microsoft Fabric
Credit Card Fraud Detection Machine Learning in Fabric Notebook
In this video, I walked you through credit card fraud detection Machine Learning task using Microsoft Fabric Notebook.
- Video · Microsoft Fabric
Create AWS S3 Bucket and Read Parquet File from Fabric Notebook
In this video, I covered how to get started with AWS S3, create S3 bucket, access key, secret key and read data in Fabric Notebook into the AWS S3. If you enjoy this video article, give it a thumps up and share with your friends.
- Article · Microsoft Fabric
Embed Power BI Report in Microsoft Fabric Notebook
In this article, I walked you through how to embed Power BI Report in Microsoft Fabric. This features enable you to version control and collaborate with others by seamlessly integrating your workspace with GitHub through Azure DevOps.
- Video · Microsoft Fabric
Cross Tab Report in Fabric Data Warehouse using PIVOT Operator
The Pivot operator allows transforming rows into columns and performing aggregation on data. It improves the readability and clarity of the query. This video shows how to create cross-tab report in Fabric Warehouse using the Pivot operator.
- Video · Microsoft Fabric
Inner Join SQL Query in Fabric Notebook using PySpark
This video shows how to write inner join SQL Query in Microsoft Fabric Notebook using Spark.
- Video · Microsoft Fabric
How To Implement Dynamic Data Masking in Fabric Data Warehouse
In this video, I talked about how to implement dynamic data masking in fabric data warehouse.