Loading
Articles by Abiola David
- Microsoft Fabric
Mastering PySpark's EXPLODE Function in Fabric Notebooks
Learn how to master the EXPLODE function in PySpark using Microsoft Fabric Notebooks. This guide simplifies how to transform nested arrays or maps into separate rows for easier analysis.
- Microsoft Fabric
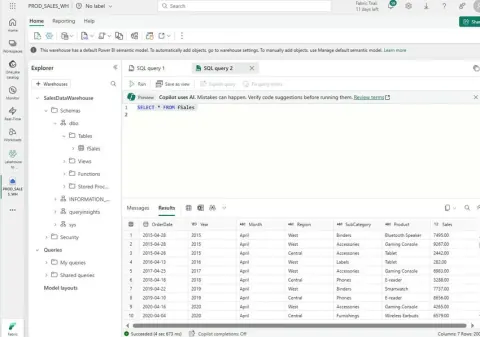
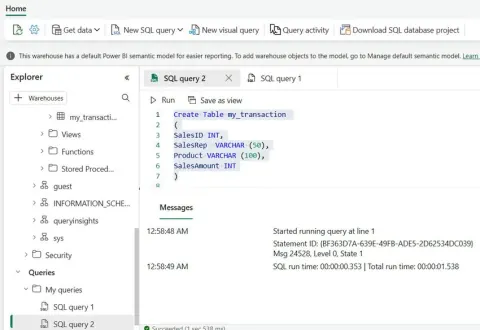
Microsoft Fabric Warehouse Integration in VS Code for Devs
Experience seamless development with Microsoft Fabric and VS Code integration. Write, debug, and manage SQL queries directly in your editor, connect to Fabric Warehouse, and boost productivity with real-time data access.
- Power BI
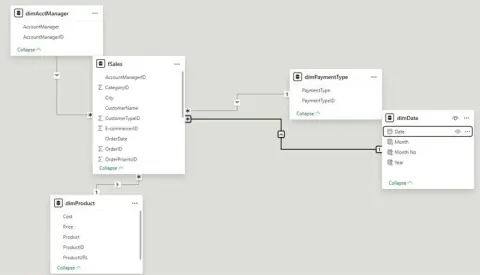
Mastering the Power of Calendar Tables in Power BI with ADDCOLUMNS in DAX
This article covers creating dynamic, customizable date tables for advanced time intelligence, enabling better reporting, filtering, and analysis in your Power BI dashboards.
- Power BI
Mastering Power BI Time Intelligence DAX: YTD, QTD, MTD, % of Total, YOY & More
Master essential Time Intelligence DAX functions in Power BI to analyze trends, compare year-over-year data, and build dynamic, time-aware reports that drive smarter business decisions and insights.
- Microsoft Fabric
Modern Data Wrangling with Polars and Delta Lake in Microsoft Fabric
Learn how to efficiently clean, transform, and manage large datasets with high-performance tools. Discover scalable, fast, and flexible data workflows designed for today’s data engineering needs.
- Power BI
Bring Your Data From Azure Data Lake Storage Gen2 to Power BI
Connect Power BI Desktop to Azure Data Lake Storage Gen2, combine CSV files in Power Query, transform the data, and create a sales report.
- Microsoft Fabric
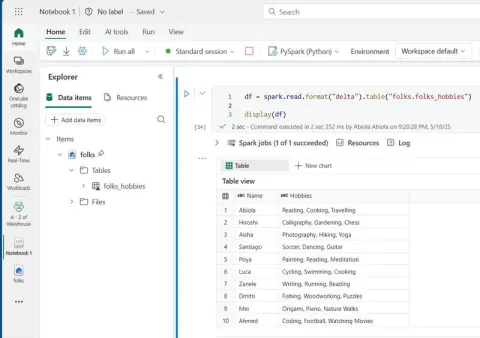
Viewing the Content of Spark DataFrames in Fabric Notebook
Discover techniques to preview, filter, and analyze large datasets using Apache Spark. Whether you're working with PySpark or big data processing, enhance your workflow with efficient DataFrame visualization.
- Microsoft Fabric
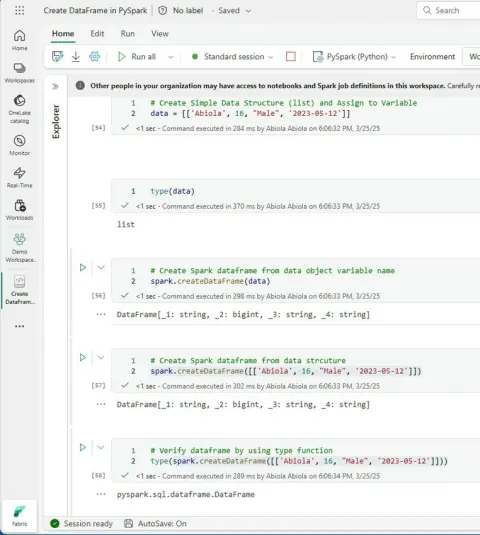
Creating DataFrames in PySpark Using Fabric Notebook
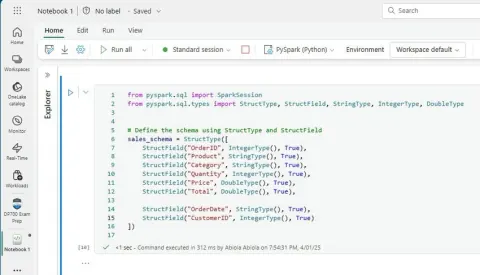
This article walks through defining schemas, specifying column names, and using SQL-like DDL in a Fabric Notebook. Explore StructType, StructField, and various ways to display and verify DataFrame content efficiently.
- Databricks
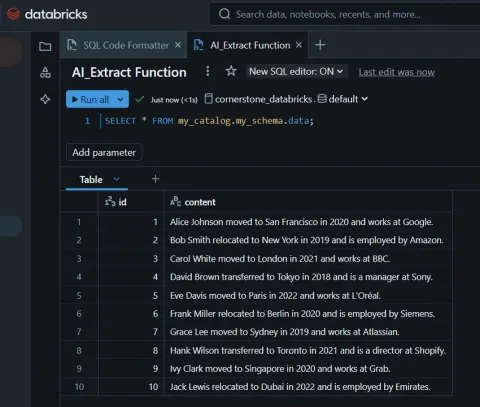
Understanding the AI_EXTRACT SQL Function in Databricks
Learn how to use Databricks AI_EXTRACT to pull entities such as people, dates, locations, and organizations from unstructured text with SQL.
- Data Science
Getting Started with Databrick Dataset
This article dives into how to use databricks preloaded datasets. Databricks Datasets provide ready-to-use, real-world data built into the Databricks platform, enabling users to easily access, analyze, and refine machine learning, big data, and data science projects seamlessly.
- Microsoft Fabric
New in Fabric Warehouse SQL: TRUNCATE
The SQL TRUNCATE command, newly introduced in Fabric Warehouse, offers an efficient way to delete all rows from a table without logging individual row deletions.
- Azure
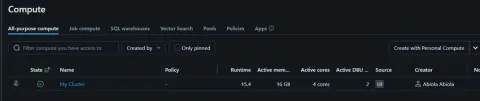
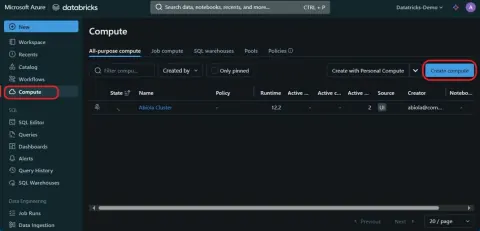
Azure Databricks Cluster
Azure Databricks simplifies big data analytics and machine learning with managed Spark clusters on Azure. It scales dynamically, optimizing resource usage and costs. Integrated with Azure services, it supports high-performance data processing.
- Microsoft Fabric
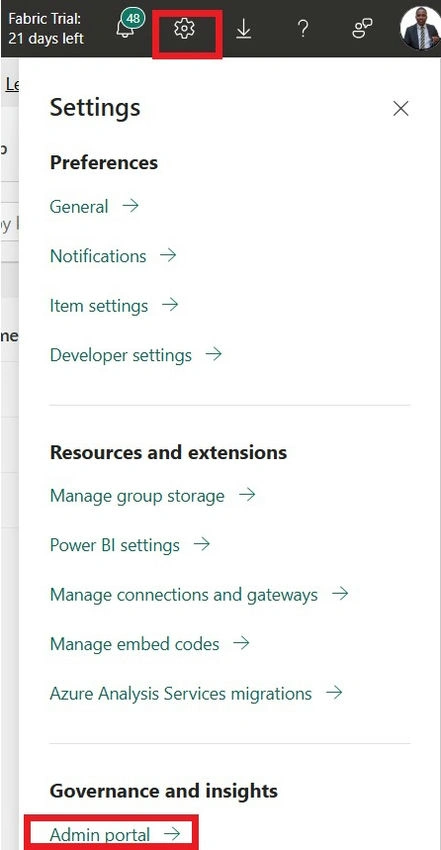
Enabling GitHub Integration in Microsoft Fabric
Learn how to enable GitHub integration in the Microsoft Fabric Admin Portal, configure delegate settings, and connect a GitHub account for workspace Git integration and CI/CD workflows.
- Microsoft Fabric
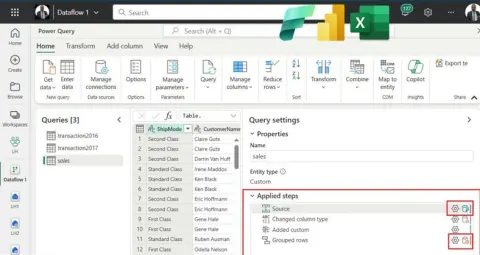
Query Folding in Fabric Dataflow Gen2 (Power Query Online)
Understanding Query Folding in Fabric Dataflow Gen2 (Power Query Online)" explores the concept of query folding within Microsoft's advanced data integration tool. Learn how query folding optimizes data transformation processes, enhances performance, and streamlines ETL tasks in Power Query Online.
- Microsoft Fabric
Fabric Lakehouse to Snowflake: Seamless Data Integration Pipeline
Explore seamless data integration from Fabric Lakehouse to Snowflake Database using a robust data pipeline. This process involves extracting, transforming, and loading data efficiently, ensuring smooth migration and synchronization between the two platforms.
- Microsoft Fabric
Guide to Endorsing Fabric Items: Promoting and Certifying
One of the crucial responsibilities of #FabricAdmin is ensuring high-quality and trustworthy items are endorsed either by promoting or certifying those items. In this definitive guide, I explained how to practically endorse items by promoting and certifying Fabric items.
- Microsoft Fabric
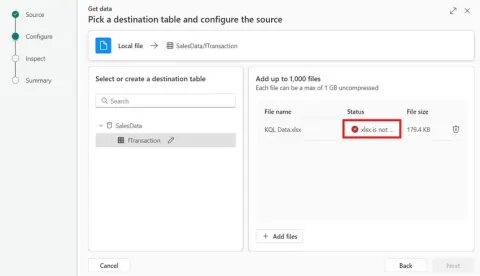
Supported File Types for Data Ingestion into KQL Database in Fabric
This article is about Understanding the Supported File Types for Data Ingestion into the KQL Database in Fabric Real-time Analytics. Supported file types include JSON, CSV, XML, & Text. Note: XLSX is not supported. See how to ingest & transform data using Data Factory.
- Microsoft 365
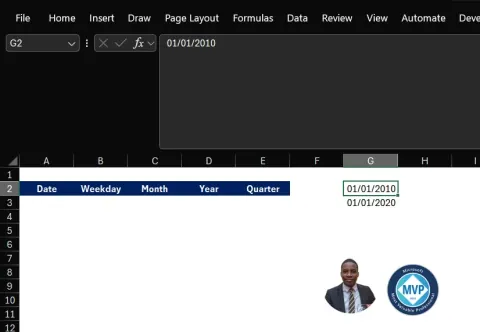
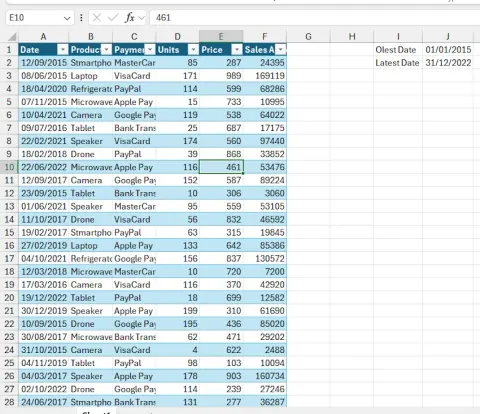
Excel Formula: Generate Random Dates and Extract Day, Month, Year, Quarter
This article shows how to Generate Randomised Dates and Extract Day, Month, Year, and Quarter using a Single Formula in Excel. Explore advanced Excel formulas using the LET function and dynamic arrays to generate 100,000 rows of randomized dates.
- Microsoft Fabric
Generate Bell-Shaped Distribution: PySpark & Matplotlib in Fabric Notebook
Learn how to generate and visualize a bell-shaped or normal distribution using PySpark and Matplotlib in Microsoft Fabric Notebook. Explore the characteristics of a normal distribution, its symmetry, central tendency, and variability.
- Microsoft Fabric
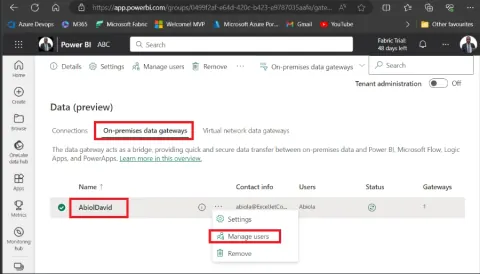
Sharing Data Gateway in Microsoft Fabric Portal with Demo
This article dives into how to share data gateway with users and resource groups in Microsoft Fabric. The Sharing Data Gateway in Microsoft Fabric Portal streamlines access and data transfer between on-premises and the cloud, promoting collaboration, optimizing resource usage and ensuring security.
- Microsoft Fabric
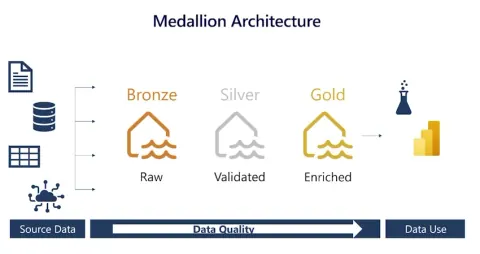
Undertanding Medallion Architecture in Microsoft Fabric Lakehouse
Learn how Medallion Architecture organizes Microsoft Fabric Lakehouse data into Bronze, Silver, and Gold layers for progressively refined analytics data.
- Microsoft Fabric
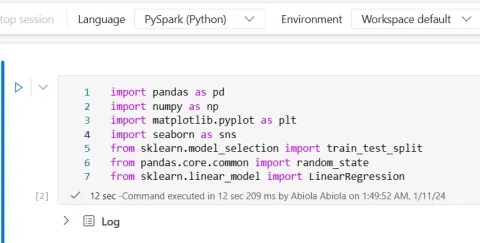
Implementing Simple Linear Regression Model in Fabric Notebook
This article dives into how to implement a simple linear regression model in Microsoft Fabric Notebook. The main goal of simple linear regression is to find the best-fitting line through the data points that minimizes the sum of the squared differences between the observed values.
- Microsoft Fabric
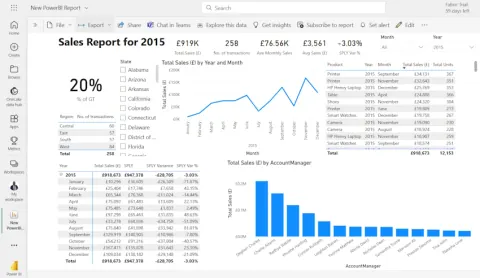
Embed Power BI Report in Microsoft Fabric Notebook
In this article, I walked you through how to embed Power BI Report in Microsoft Fabric. This features enable you to version control and collaborate with others by seamlessly integrating your workspace with GitHub through Azure DevOps.
- Microsoft 365
Using Date Function in Data Validation in Excel
Learn how to use Excel's DATE function for effective data validation. Set criteria for a date column to ensure entries fall within a specific range, enhancing accuracy and data quality.
- Microsoft 365
VSTACK Append in Excel with Total Row
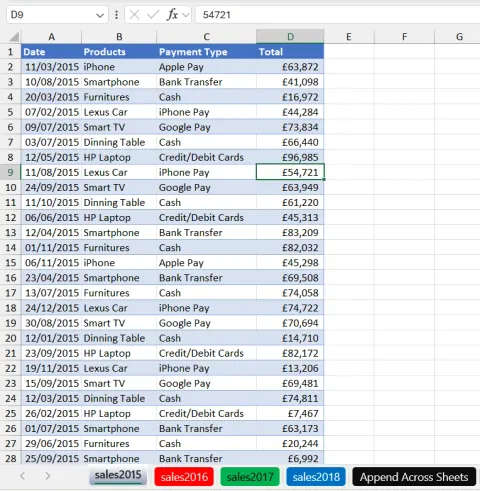
In the article, Explore the power of Microsoft Excel with the LET, VSTACK, and HSTACK functions. This article guides you through creating complex formulas for dynamic data combination and summarization across multiple tables.