Loading
Articles by Abiola David
- Microsoft Fabric
Fabric Data Warehouse: Save as Table and Analyze Result Functionalities
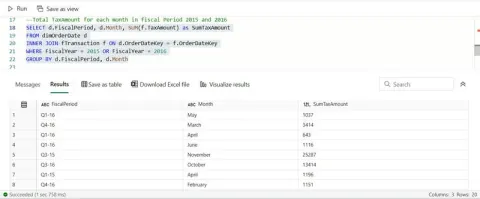
In this article, we'll delve into the Microsoft Fabric Data Warehouse features: Save as Table and Analyze Result. These functionalities offer users and analysts several advantages in terms of data management and visualization.
- Microsoft Fabric
Analyzing Sales Data with a Comprehensive SQL Query in Microsoft Fabric Data Warehouse
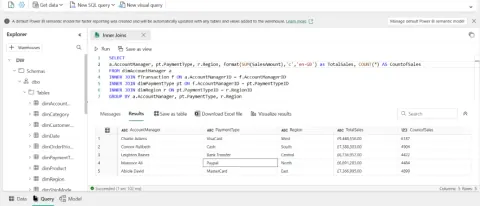
This SQL query is a powerful tool for in-depth sales analysis, utilizing joins and aggregations to break down sales data by account manager, payment type, and region in Microsoft Fabric Data Warehouse.
- Microsoft Fabric
Microsoft Fabric Licensing and Pricing for UK South and West Regions
The UK South and UK West regions of Microsoft Fabric provide cloud-based data integration and analytics capabilities, with a focus on meeting data residency requirements in the United Kingdom. The pricing structure for Microsoft Fabric is based on Capacity Units (CUs), with costs varying depending on the region and subscription plan. For the UK South and West Regions, the pay-as-you-go hourly and monthly rates are presented in a cost-efficient manner.
- Microsoft Fabric
What is DirectLake in Microsoft Fabric Data Warehouse and its Benefits?
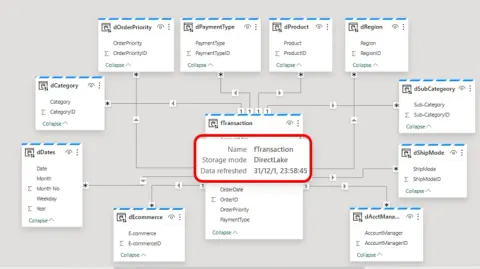
This article focuses on DirectLake in Microsoft Fabric Data Warehouse and its Benefits. DirectLake is a feature of Microsoft Fabric Data Warehouse that allows analysts, engineers, and users to access and query data directly from Azure Data Lake Storage without loading the data into the warehouse.
- Business Intelligence(BI)
Efficient Data Integration using HSTACK & XLOOKUP Functions
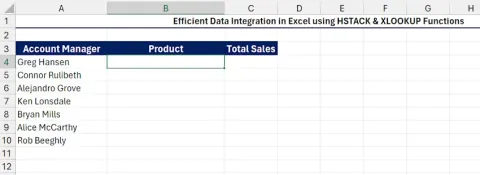
This article effectively explains how to integrate data from different sources using Excel's HSTACK and XLOOKUP functions. The step-by-step breakdown and the clear demonstration with sample data make it easy for readers to understand and implement the data integration process seamlessly.
- Microsoft Fabric
What is OneLake in Microsoft Fabric And Its Benefits?
This article is about OneLake in Microsoft Fabric. OneLake, an integral part of Microsoft Fabric, provides a robust and streamlined approach to analytics data management within organizations. Leveraging the power of Azure Data Lake Storage (ADLS) Gen2, OneLake offers several distinct advantages that make it a valuable asset for businesses.
- Business Intelligence(BI)
Creating a Calendar Table in Excel Power Query and its Benefits
This blog is based on Creating a Calendar Table in Excel Power Query
- Microsoft Fabric
How to Create Table & Insert Records in Microsoft Fabric Data Warehouse SQL Endpoint
This article covers how to create table and insert records in the Microsoft Fabric Data Warehouse SQL Endpoint
- Power BI
Editing Visualizations Interactions in Power BI
Discover how to edit visualization interactions in Power BI to control filtering, highlighting, and cross-filtering between visuals—unlocking deeper insights and making your reports more dynamic and meaningful.
- Power BI
Publishing Power BI Report into the Power BI Service
Learn how to publish your Power BI Desktop reports to the Power BI Service for secure cloud access, easy sharing, real-time updates, and effective collaboration with colleagues and stakeholders.
- Business Intelligence(BI)
Microsoft Fabric Data Engineer: A New Career Pathway
This article introduces Microsoft Fabric Data Engineers—professionals who design and manage data systems using lakehouses. It highlights their skills, tools, and role in unlocking data-driven value for organizations.
- Python
Python in Excel Data Analysis using the New PY Function
This article delves into performing Data Analysis using the new Python in Excel PY function
- .NET
Microsoft Fabric Lakehouse And How To Engineer Data Into The Lakehouse
This article explains how to use Microsoft Fabric Lakehouse in Synapse Data Engineering to centralize, manage, and analyze data. It covers components, setup, workspaces, data ingestion, and practical tools.
- SQL Server
Transferring Data from One Table to Another Across Databases
This article explores how to ingest data from a table in SalesData database to another table in the Data Warehouse database.
- Power BI
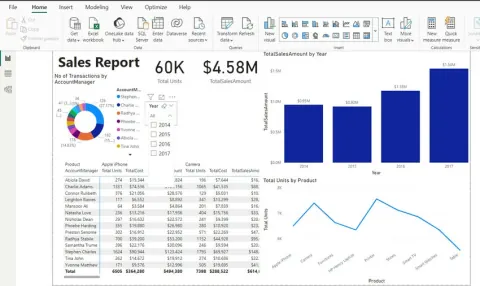
Understanding Power BI Reports and Dashboards
This article explores the difference between Power BI Reports and Dashboards and how to pin a report to a dashboard in the Power BI Service.